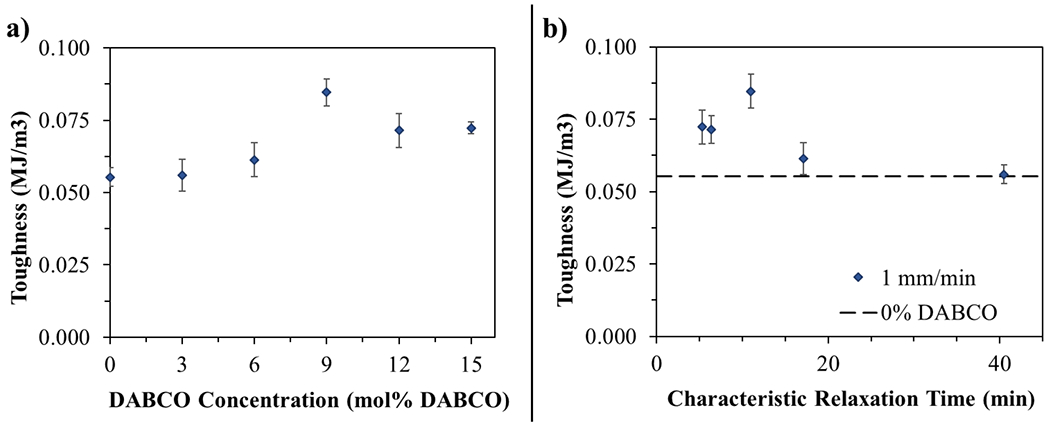
Figure 2.

(a) Toughness measured by tensile test as a function of mol % DABCO tested at a strain rate of 1 mm/min. (b) Toughness as a function of the characteristic relaxation time as measured by stress relaxation for each catalyst concentration. Toughness values were calculated by taking the area under the stress–strain curve. Error bars are the standard error at each catalyst concentration with a minimum of five replicates.
