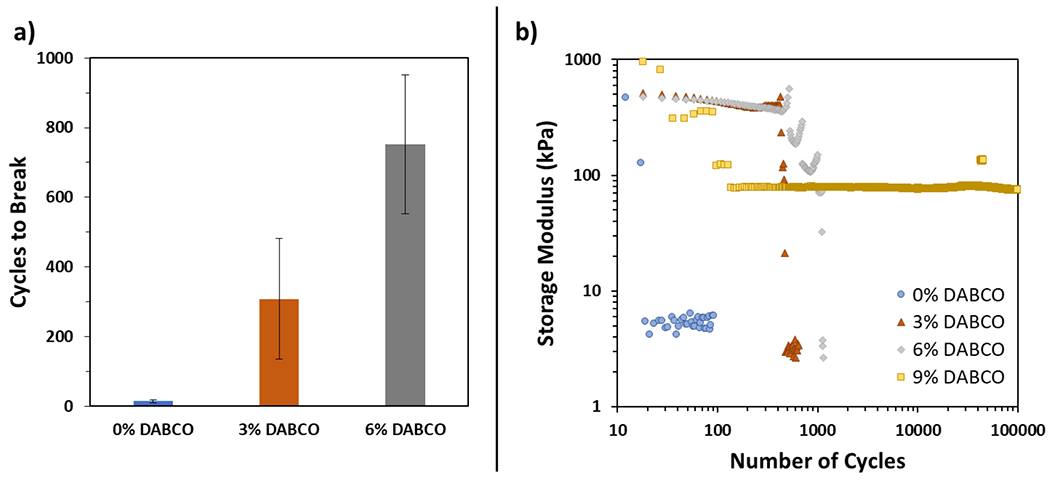
Figure 4.

(a) Cycles to break during fatigue testing at 6% strain and 10 Hz for 0, 3, and 6 mol % DABCO. The 9 mol % DABCO specimens are not depicted here because they did not fail after the full duration of 100 000 cycles. Error bars represent the standard error of the data. (b) Representative log–log plot of the storage modulus as a function of number of cycles during fatigue testing for 0, 3, 6, and 9 mol % DABCO samples.
