Figure 1.
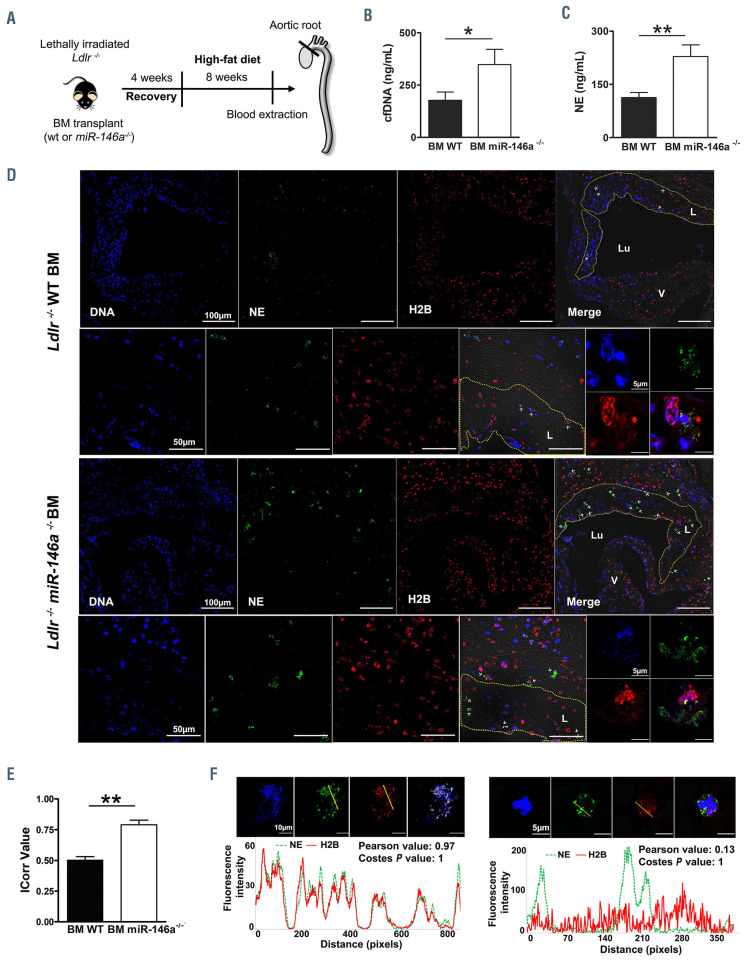
miR-146a deficiency enhances neutrophil extracellular trap formation in atherosclerosis. (A) Ldlr-/- mice were transplanted with bone marrow (BM) from miR-146a-/- or wild-type (WT) mice. After 4 weeks of recovery, mice were fed a high-fat diet for 8 weeks. Blood and aortic tissues were extracted for quantification of the formation of neutrophil extracellular traps (NET) (n=10-12/group). (B) Plasma cell-free (cf)DNA was measured using Sytox Green. (C) Plasma neutrophil elastase (NE) activity was quantified by enzyme-linked immunosorbent assay. (D) Representative confocal microscopy images of an aortic valve leaflet, an atherosclerotic area, and a NET detail from Ldlr-/- BM WT, and Ldlr-/- BM miR-146a-/ mice immunostained for DNA (DAPI, blue), NE (green), and H2B (red). The dashed yellow line denotes an atherosclerotic lesion (L) boundary; the lumen (Lu), and valves (V) are also marked. White arrowheads point to NET. (E) NET quantification in aortic valve sections from Ldlr-/- BM WT, and Ldlr-/- BM miR-146a-/- mice performed with the Colocalization Colormap Fiji plugin. The correlation index (ICorr) represents the fraction of positively correlated (co-localized) H2B and NE pixels in one representative section per mouse in six WT and six miR-146a-/- BM-transplanted Ldlr-/- mice. (F) Fluorescence intensity plots of H2B and NE in a region of interest (yellow line) of a NET and a neutrophil found in the aortic valve from a Ldlr-/- BM miR-146a-/- and a Ldlr-/- BM WT mouse, respectively. The correlation of H2B and NE fluorescence intensity was determined using the Pearson correlation coefficient and Costes method. In the Pearson correlation test, the R value ranges between -1 and 1, with 1 being a perfect correlation, 0 no linear correlation, and −1 a perfect negative linear correlation. Costes analysis compares pixel correlation for no-randomized with randomized images and calculates significance. The Costes P-value was 1 in both cases, indicating that the probability of random images correlating to real images is 0. P-value calculations were performed using the Mann-Whitney U test. Data represent mean ± standard error of mean, *P<0.05, **P<0.01.

