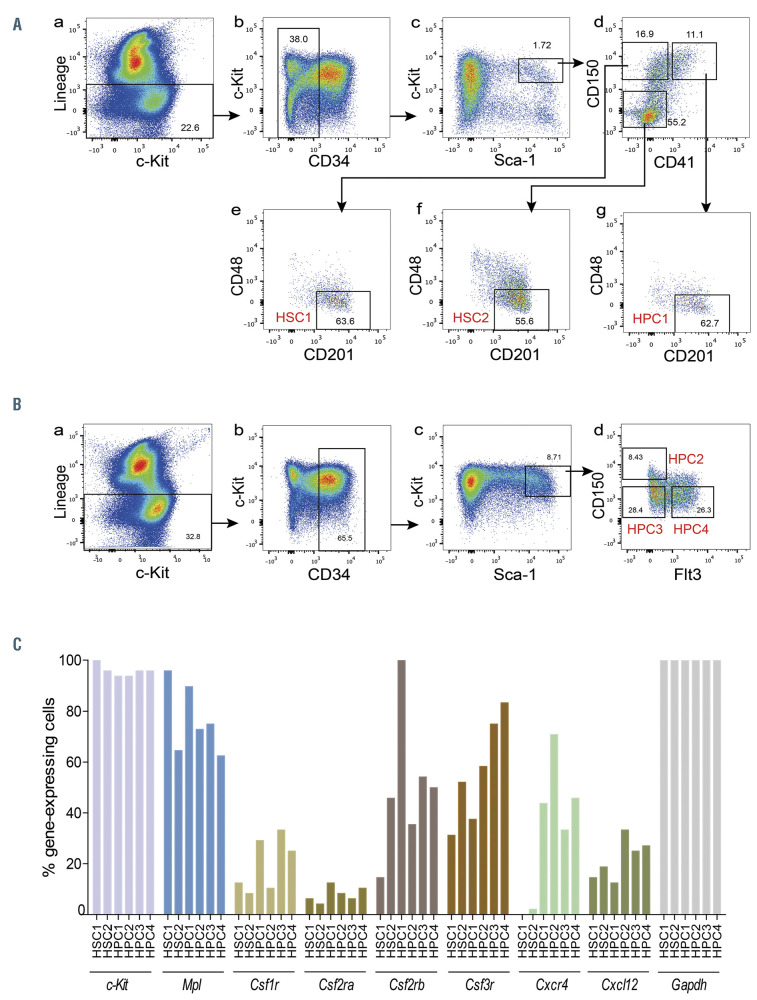
Figure 1.
Gating strategy and single-cell real-time-polymerase chain reaction (RT-PCR) of HSC1, HSC2, HPC1, HPC2, HPC3, and HPC4 cells. (A) HSC1, HSC2, and HPC1 gating. Bone marrow (BM) cells were stained with antibodies and gated as follows. (a) Gating for lineage– cells (Lin– cells). (b) Gating for Lin–CD34– cells. (c) Gating for CD34– c-Kit+ Sca-1+ Lin– cells (CD34–KSL cells). (d) Based on CD150 and CD41 expression, CD34–KSL cells were divided into CD150+CD41–, CD150–CD41–, and CD150–CD41+ cells. (e-g) CD201+CD48– cells were further selected from CD150+CD41–, CD150–CD41–, and CD150–CD41+ cells. HSC1, HSC2, and HPC1 cells were defined as CD201+CD150+CD48–CD41–CD34–KSL cells, CD201+CD150–CD48–CD41–CD34–KSL cells, and CD201+CD150–CD48–CD41+CD34–KSL cells, respectively. (B) HPC2, HPC3, and HPC4 gating. BM cells were stained with antibodies and gated as follows. (a) Gating for lineage– cells (Lin– cells). (b) Gating for Lin–CD34+ cells. (c) Gating for CD34+KSL cells. (d) CD34+KSL cells were divided into CD150+Flt-3–, CD150–Flt-3–, and CD150–Flt-3+ cells. HPC2, HPC3 and HPC4 cells were defined as CD150+Flt-3–CD34+KSL cells, CD150–Flt-3–CD34+KSL cells, and CD150–Flt-3+CD34+KSL cells, respectively. (C) Single-cell RT-PCR for six populations. The percentage of gene-expressing cells is shown. Gene-expressing cells are defined by a threshold cycle (Ct) value < 27.65.

