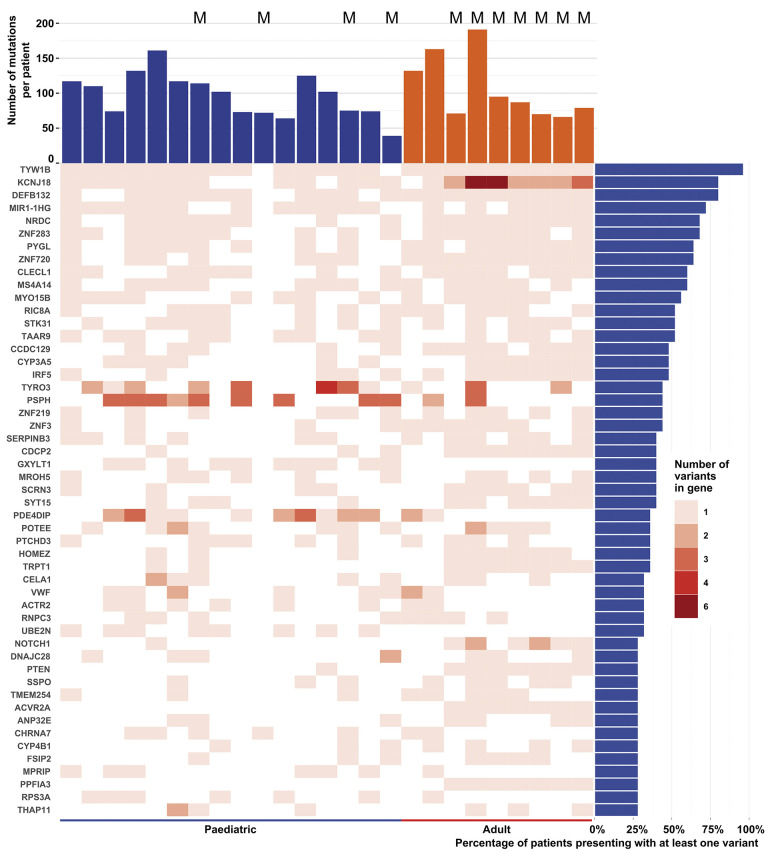
Figure 1.
Summary of whole exome sequencing data. Individual results for each patient presented as a heatmap for genes found to be mutated in at least a quarter of patients. The number of different variants presenting in each gene is displayed for individual patients. The total number of variants identified for individual patients is also displayed above the graph. The panel on the right shows the percentage of patients presenting with at least one variant of the indicated gene. Pediatric and adult patients are separated. Patients for whom matched peripheral blood was sequenced are labeled with an ‘M’.

