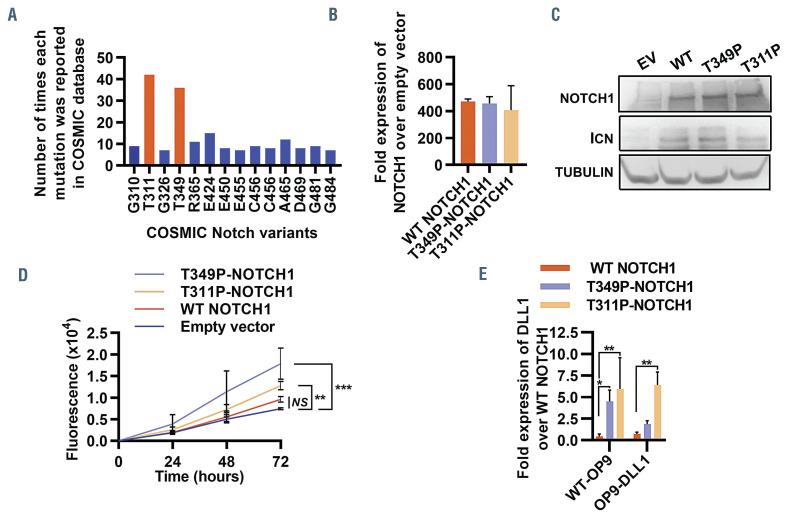
Figure 3.
NOTCH1 T349P and T311P mutants confer a growth advantage to cells. (A) The most frequent variants (of the amino acids involved in the NOTCH1-JAG1 interface) of NOTCH1 reported on COSMIC, and the frequency at which they have been reported. (B) Quantitative polymerase chain reaction (qPCR) showing the foldincrease in transcript levels of NOTCH1 compared to that in cells transduced with an empty vector (n=3). (C) Western blot for full-length and cleaved intracellular NOTCH1 (ICN) and α-tubulin in HEK293FT cells 48 h after transfection to express wild-type (WT) or mutant (T349P or T311P) NOTCH1, or an empty vector (EV). Only the relevant sections of the whole blot are shown and the contrast of the whole image was modified in order to improve legibility. Data are representative of three biological repeats. (D) Proliferation of HEK293FT cells expressing the indicated proteins or empty vector control as measured by the Real Time Glo assay at 24, 48 and 72 h after transfection (***P<0.001; n=3). (E) Fold-change in expression of DLL1 over the WT NOTCH1 control as assessed by qPCR in HEK293FT cells expressing the indicated proteins and co-cultured with either WT or DLL1-expressing OP9 cells (*P<0.05; **P<0.01; n=3). All bar plots display the mean of biological replicates, and error bars represent the standard deviation.

