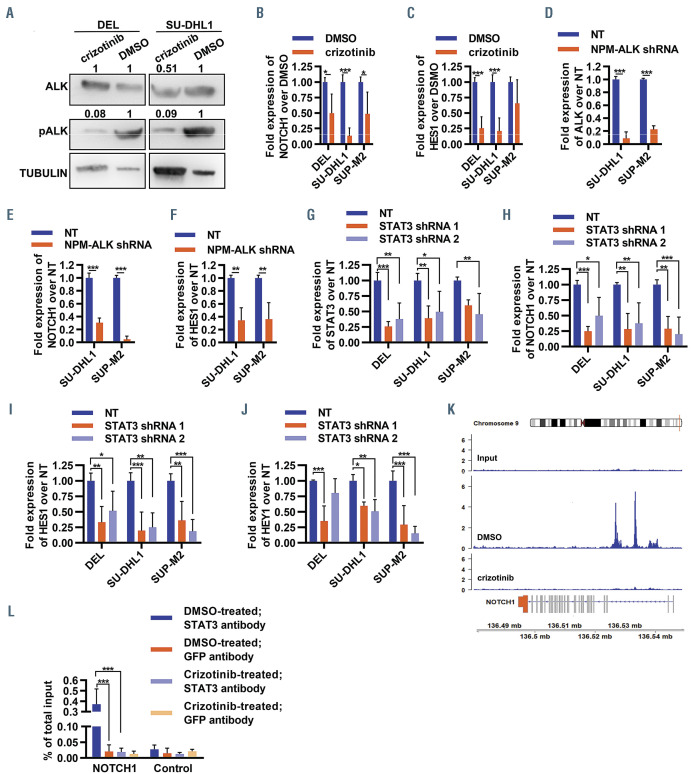
Figure 4.
STAT3-mediated regulation of NOTCH1 by NPM-ALK in ALK+ anaplastic large cell lymphoma. (A) Representative western blot for ALK, phospho-ALK and α- tubulin in ALK+ anaplastic large cell lymphoma (ALCL) cell lines when treated with 300 nM crizotinib or a vehicle control (dimethylsulfoxide, DMSO) for 6 h. Only the relevant sections of the whole blot are shown and the contrast of the whole image was modified in order to to improve legibility. Data are representative of three biological replicates. Densitometry is included, as fold-change over the vehicle control and loading control. (B, C) Fold-change expression of NOTCH1 (B) and HES1 (C) over vehicle control in the indicated ALK+ ALCL cell lines 48 h after treatment with crizotinib, as determined by quantitative polymerase chain reaction (qPCR) (*P<0.05; **P<0.01; ***P<0.001; n=3). (D-F) Fold-change expression of NPM-ALK (D), NOTCH1 (E) and HES1 (F) over non-targeting control in ALK+ ALCL cell lines 48 h after transduction with control non-targeting (NT) shRNA, or a shRNA targeting NPM-ALK, as determined by qPCR (**P<0.01; ***P<0.001; n=3). (G-J) Foldchange expression of STAT3 (G), NOTCH1 (H), HES1 (I) and HEY1 (J) over non-targeting NT control in ALK+ ALCL cell lines 48 h after transduction with control NT shRNA, or one of two shRNA targeting STAT3, as determined by qPCR (**P<0.01; ***P<0.001; n=3). (K) Binding of STAT3 to the promoter regions of NOTCH1 in SUDHL1 cells treated with a vehicle control (middle track) or crizotinib (lower track); the upper track is the input for two separate cell lines, data were obtained by analyzing previously published data.37 (L) Chromatin immunoprecipitation-qPCR binding of STAT3 and GFP at the NOTCH1 promoter region, or at a negative control intergenic region, in SUP-M2 cells treated with either a vehicle control or crizotinib (300 nM) for 6 h, as determined by qPCR (***P<0.0001; n=3), expressed as the percentage of the total input. All measures of expression by qPCR were normalized to GAPDH and PPIA. All bar plots display the mean of biological replicates, and error bars represent standard deviations.

