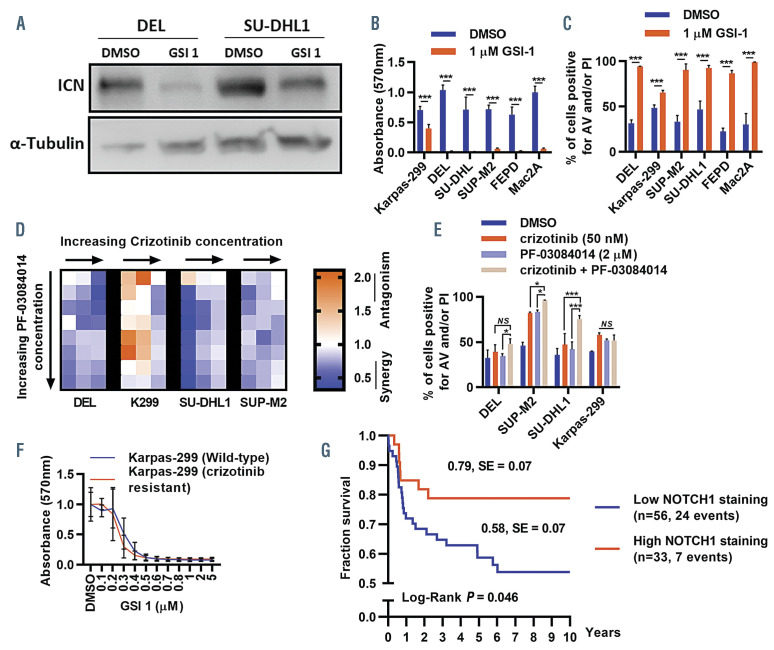
Figure 6.
ALK inhibitor sensitive and resistant anaplastic large cell lymphoma cell lines are sensitive to γ-secretase inhibitors. (A) Western blot for cleaved intracellular NOTCH1 (ICN) and α-tubulin in ALK+ anaplastic large cell lymphoma (ALCL) cell lines when treated with 1 mM GSI-I for 48 h. Only the relevant sections of the whole blot are shown and the contrast of the whole image was modified in order to improve legibility. Data are representative of three biological repeats. (B) Proliferation of a panel of ALK+ and ALK– ALCL cell lines treated with 1 mM of GSI-I for 48 h, compared to vehicle control, as measured by the MTT assay (***P<0.0001; n=3). (C) Quantification of the percentage of cells positive for annexin V (AV) and/or propidium iodide (PI) when treated with either vehicle control or 1 mM GSI-I for 48 h (***P<0.001; n=3). (D) BLISS matrix showing the combination index on treating the indicated ALK+ ALCL cell lines with crizotinib and PF- 03084014 for 72 h (using a range of concentrations from 25 to 100 nM for crizotinib, and from 100 nM to 10 mM for PF-03084014). A combination index of <1 indicates synergy between drugs, 1 indicates additive effects, >1 indicates antagonistic effects (n=3). (E) Quantification of the percentage of cells positive for AV and/or PI when treated with either vehicle control, 50 nM crizotinib, 2 mM PF-03084014 or a combination of PF-03084014 and crizotinib for 48 h (NS: not significant; *P<0.05; ***P<0.00; n=3). (F) Proliferation over vehicle control of wild-type or crizotinib-resistant Karpas-299 cells when treated with increasing concentrations of GSI-I, as measured by the MTT assay (n=3). (G) Ten-year event-free survival of patients with ALK+ anaplastic large cell lymphoma showing either little or no (n=56), or strong (n=33) NOTCH1 expression. All bar plots display the mean of biological replicates and error bars represent standard deviations.

