
FIGURE 2.
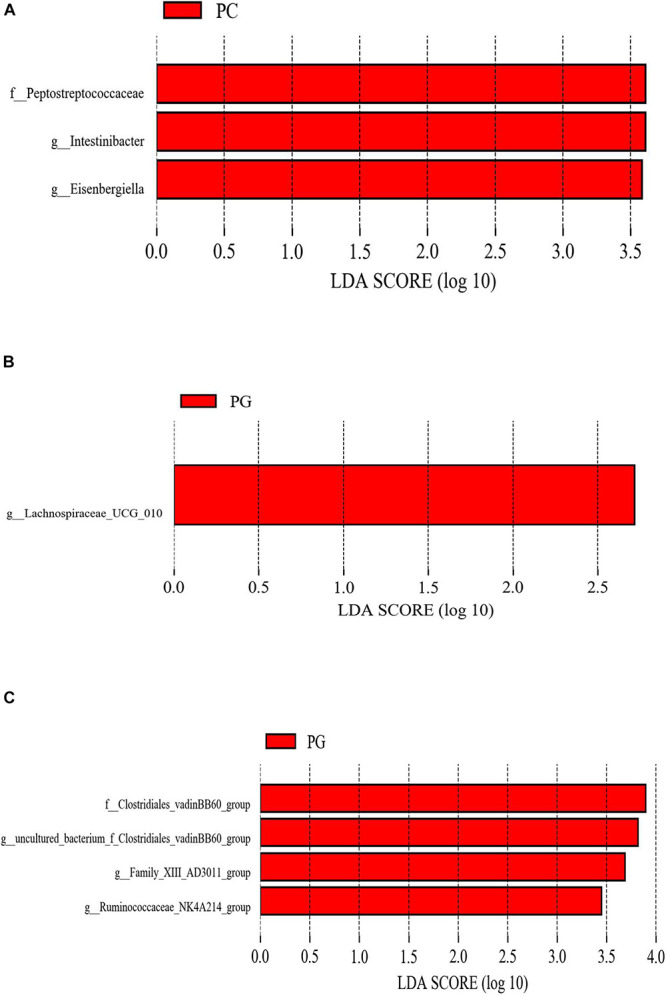
The different phylotypes differed between groups using LEfSe analysis. These figures show the bacteria of which the LDA Score is greater than the set value (the default setting is 2.0) between groups PC and PA. (A) Groups PC and PG. (B) Groups PG and PA. (C) The length of the histogram represents the size of the difference species (i.e., LDA Score), and the different colors represent the different groups. PC, basal diet + SNE; PA, basal diet extra antibiotics + SNE; PG, basal diet extra B. licheniformis + SNE.