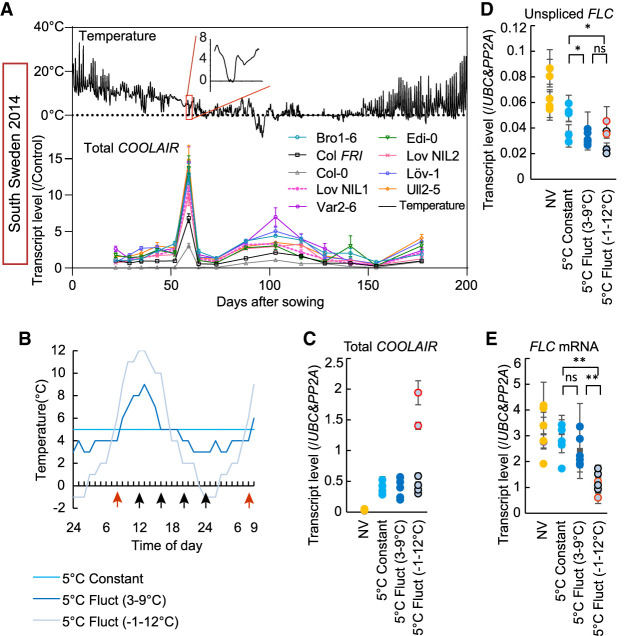
Figure 1.
COOLAIR expression is highly induced by freezing temperature. (A) COOLAIR expression in all genotypes in a field in South Sweden over winter 2014–2015. Plots in the top panel show the temperature profile in the field with the first appearance of freezing temperature highlighted and expanded in the red box. Plots in the bottom panel show the relative transcript level of COOLAIR as analyzed by RT-qPCR. (B) The temperature profiles of chambers set up to analyze the interrelationship of freezing, COOLAIR expression, and FLC expression. Plants grown in these chambers were used to generate data shown in C–E. (C–E) Relative transcript level of COOLAIR (C), unspliced FLC (D), and FLC mRNA (E) measured throughout the day (NV [nonvernalized]) and after 2 wk of different cold exposure. Results were presented by combining the data of the six sampling points from each treatment. The sampling times are indicated by arrows in B. More details are described in the Materials and Methods. (C) COOLAIR data points in red (indicated by the red arrow in B) were those taken ∼8 h after freezing. Vernalized treatments compared by ANOVA with Tukey's post hoc test. (*) P < 0.05, (**) P < 0.01, (ns) no significance. Expression data were normalized as indicated in each panel. Error bars show SEM.

