Figure 2.
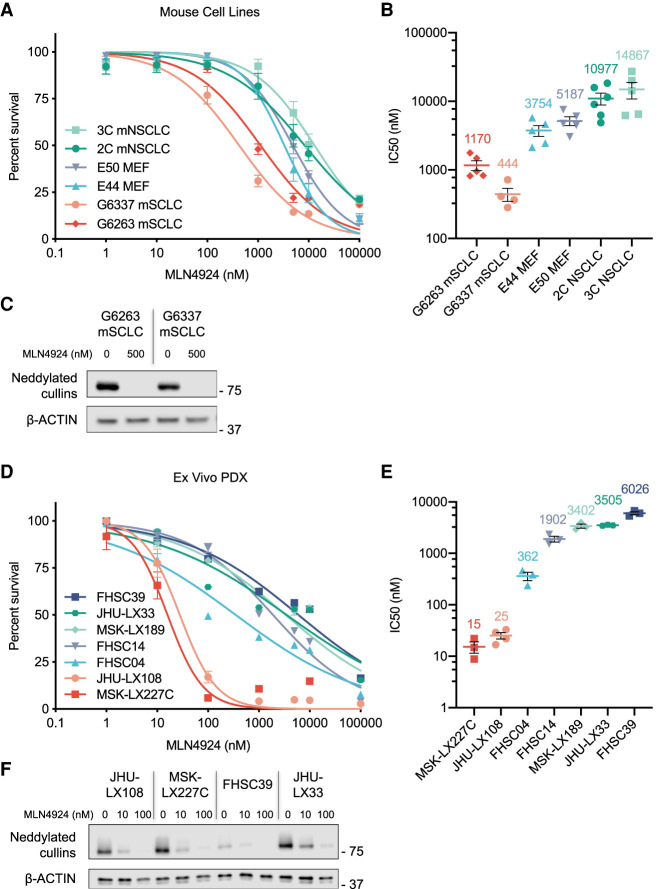
Treatment of murine SCLC cell lines and human PDX models with the neddylation inhibitor MLN4924 (A) Combined dose response curve for MLN4924-treated Rb1;Trp53–null mSCLC cell lines, Trp53–null MEFs, and Trp53-null; KRASG12D mNSCLC cell lines. Cell viability measured at 72 h by CellTiter-Glo. Data are means ± SEM. (B) Graph depicting experimental MLN4924 IC50 value replicates for mSCLC cell lines, MEF isolates, and mNSCLC cell lines. Mean IC50 value is shown above each sample set. Data are means ± SEM. The same biological replicates used for A are shown. (C) Immunoblot analysis for NEDD8 showing the levels of neddylated cullins for two mSCLC cell lines treated with MLN4924. Cells were collected after 48-h treatment of MLN4924 at two concentrations (0 and 500 nM). β-ACTIN was used as loading control. (D) Combined dose response curve for MLN4924-treated ex vivo PDX models of SCLC and extrapulmonary small cell carcinoma. Cell viability measured at 72 h by CellTiter-Glo. Data are means ± SEM. (E) Graph depicting experimental MLN4924 IC50 value replicates for PDX lines. Mean IC50 value is shown above each sample set. Data are means ± SEM. The same biological replicates used for D are shown. (F) Immunoblot analysis for NEDD8, showing the levels of neddylated cullins for MLN4924-sensitive PDX models JHU-LX108 and MSK-LX227C and the more resistant PDX models FHSC39 and JHU-LX33. Cells were collected after 48-h treatment of MLN4924 at three concentrations (0, 10, and 100 nM). β-ACTIN was used as loading control.

