Figure 3.
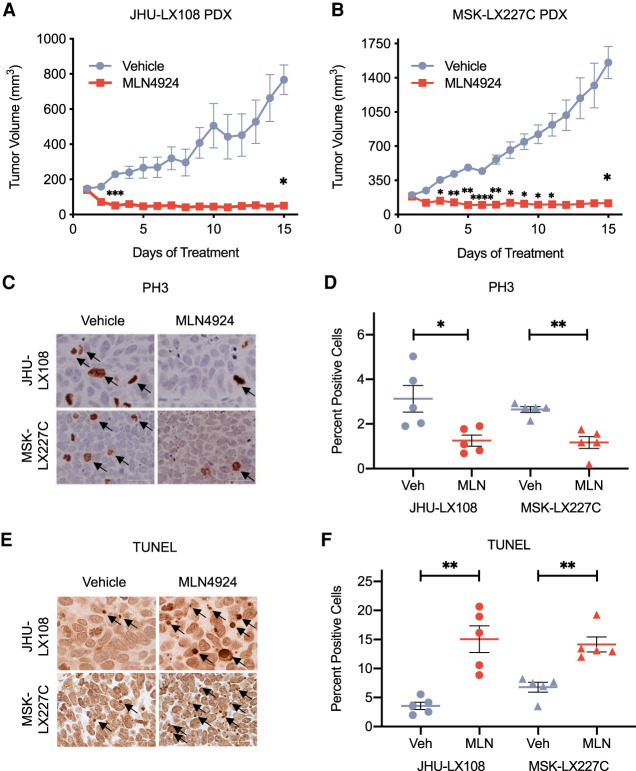
MLN4924 treatment of PDX models in vivo (A,B) Tumor growth inhibition curves of vehicle (HPBCD) and MLN4924-treated (60 mg/kg, 7 dpw) JHU-LX108 PDX (A) and MSK-LX227C PDX (B) flank tumors over 15 d. Data are means ± SEM (n = 5 animals per treatment group per PDX model). (*) P < 0.05, (**) P < 0.01, (***) P < 0.001, (****) P < 0.0001, by two-way ANOVA with Sidak's post-test. (C) Representative IHC images of PH3 staining of JHU-LX108 and MSK-LX227C tumors treated by vehicle or MLN4924. Scale bar, 100 μm. (D) Quantification of five representative PH3 IHC field images for each of the MLN4924 and vehicle-treated JHU-LX108 or MSK-LX227C tumors. (E) Representative TUNEL staining of JHU-LX108 and MSK-LX227C tumors treated by vehicle or MLN4924. Scale bar, 100 μm. (F) Quantification of five representative TUNEL field images for each of the MLN4924 and vehicle-treated JHU-LX108 or MSK-LX227C tumors. For D and F, data are means ± SEM (n = 5 in all groups). (*) P < 0.05, (**) P < 0.01, by unpaired Student's t-test.

