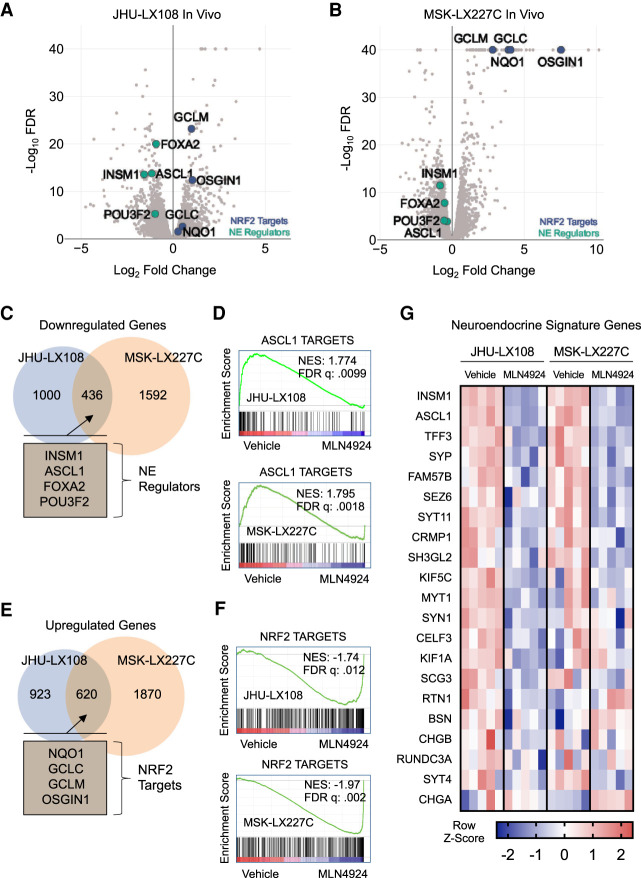
Figure 4.
Transcriptional analysis of MLN4924-treated tumors identify changes in neuroendocrine signature in high-grade neuroendocrine cancers (A,B) Volcano plots of edgeR analysis results from RNA-seq performed on five MLN4924-treated and five vehicle-treated JHU-LX108 (A) or MSK-LX227C (B) PDX tumors. Green markers indicate select neuroendocrine genes and blue markers indicate select NRF2 targets. (C) Venn diagram showing common significant down-regulated genes (FDR < .05) determined by edgeR analysis of MLN4924-treated JHU-LX108 and MSK-LX227C PDX tumors. Notable common genes highlighted in inset. (D) Gene set enrichment analysis plots for treated JHU-LX108 (top) and MSK-LX227C (bottom) tumors using list of identified ASCL1 direct targets in SCLC. (E) Venn diagram showing common significant up-regulated genes (FDR < .05) determined by edgeR analysis of MLN4924-treated JHU-LX108 and MSK-LX227C PDX tumors. Notable common genes highlighted in the inset. (F) Gene set enrichment analysis plots for treated JHU-LX108 (top) and MSK-LX227C (bottom) tumors using list of NRF2 targets. (G) Heat map of select differentially expressed neuroendocrine signature genes for MLN4924-treated JHU-LX108 or MSK-LX227C PDX tumors compared with vehicle treatment. Color indicates Z-score for each comparison (five vehicle vs. five MLN4924).

