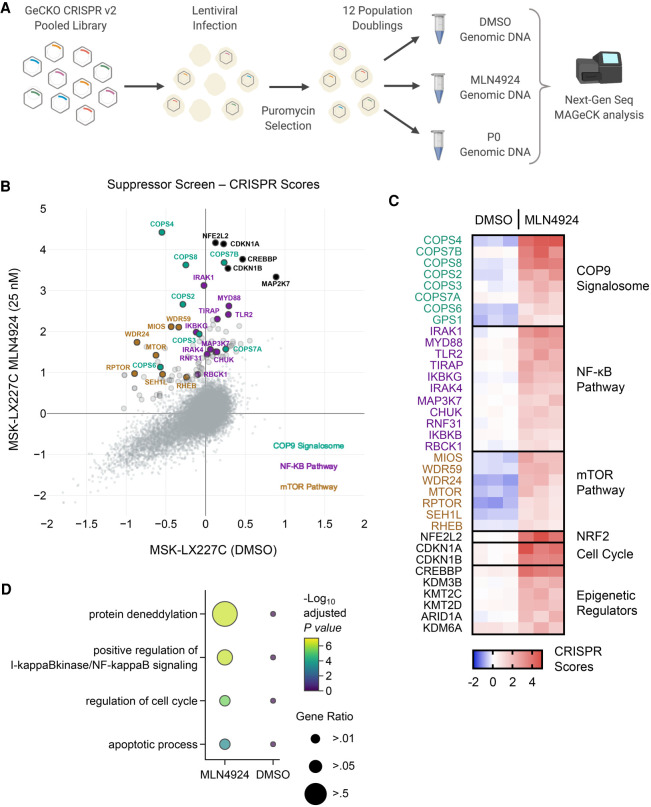
Figure 6.
Whole-genome CRISPR suppressor screen of MLN4924-treated MSK-LX227C cells identifies the COP9 signalosome, NF-κB, and mTOR pathways as potential mechanisms of sensitivity and resistance. (A) Schematic of the CRISPR/Cas9 dropout screen conducted using the GeCKO v2 lentiviral human library. (B) X,Y plot of average CRISPR scores for the MSK-LX227C MLN4924 (25 nM) and MSK-LX227C DMSO data sets. Enlarged markers indicate genes falling above the y = x + 1 line. Notable genes are labeled and colorized according to pathway identity (n = 3 biological replicates for each screen data set). (C) Heat map of top enrichment CRISPR scores organized by select pathways for the three MSK-LX227C DMSO replicates and three MSK-LX227C MLN4924 (25 nM) replicates. (D) Pathway dot plot for significant enriched genes filtered by MAGeCK analysis for both the MSK-LX227C MLN4924-treated and DMSO data sets (FDR < 0.1). Pathway analysis performed with Enrichr and GO biological process gene ontology. Dot color indicates significance and dot size represents the proportion of genes identified in the pathway.

