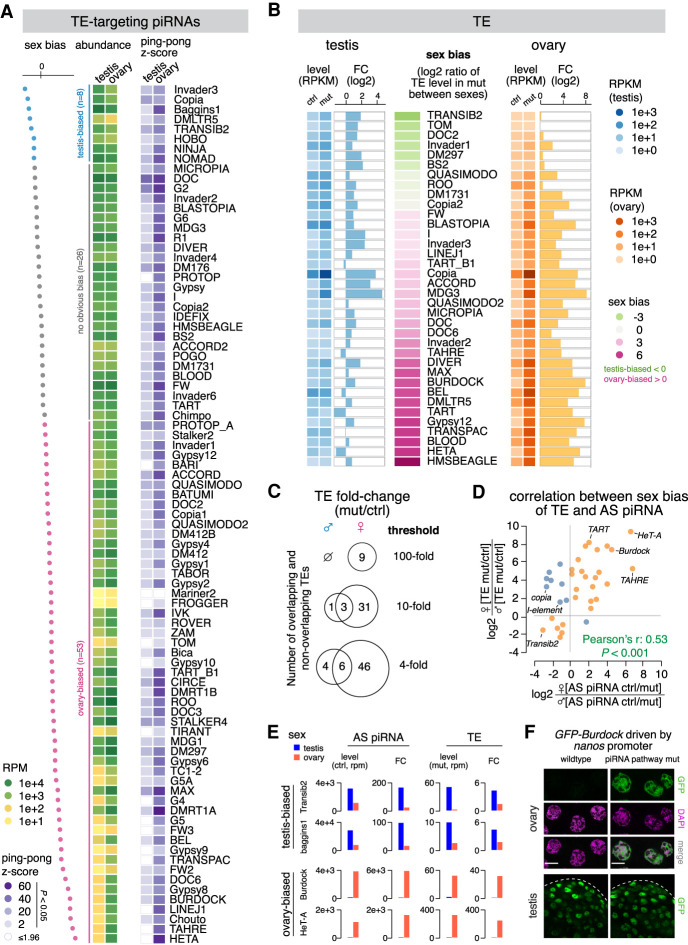
Figure 2.
Sexually dimorphic piRNA programs parallel sex-specific TE expression. (A) Heat maps showing the abundance of antisense piRNA (left) and ping-pong z-score (right) for each TE family in the two sexes. Statistically significant ping-pong z-scores (z > 1.96, equivalent to P < 0.05) are color-coded, while the remaining are marked as blank. TE families are sorted by sex bias of piRNA expression, defined as the log2 ratio of antisense piRNA abundance in testis over ovary. TEs with more than twofold differences in antisense piRNAs are colored as testis-biased (blue) and ovary-biased (pink), respectively, with the remaining having no obvious bias (gray). (B) Expression of 36 TE families that are regulated by rhi (see the Materials and Methods) in the testis (left) and ovary (right). TE families are sorted by sex bias of their expression in piRNA pathway mutant (rhi−/−), defined as the log2 ratio between sexes. Heat maps display TE levels in control and mutant, while bar graphs show the fold change of expression in mutant over control. (C) Venn diagrams of the number of TEs showing 100-fold, 10-fold, and fourfold derepression in rhi mutant over control of the two sexes. (D) Scatterplot displaying the correlation between sex biases of TE and TE antisense piRNA. For each TE family, the loss of antisense piRNAs in rhi mutants was calculated in each sex (ctrl over mut). The sex bias of piRNAs was defined as the log2 ratio of piRNA loss in female over male. Similarly, TE derepression in rhi mutants was calculated in each sex (mut over ctrl), and the sex bias was defined as the log2 ratio of TE derepression in female over male. TE families that show a correlation between the sex bias of antisense piRNA and that of TE derepression are colored as orange, with the rest as blue. (E) Histograms showing profiles of two sex-biased TEs for each sex. Antisense piRNA levels refer to those in control gonads, TE levels refer to those in piRNA pathway mutants (rhi−/−), and the fold change is calculated as mutant over control for TEs and the reverse for antisense piRNAs. (F) Confocal images of stage 7–8 nurse cells in ovary (top) and the apical tip of testis (bottom) that express a Burdock fused GFP reporter in wild-type and piRNA pathway mutant (rhi−/−) background, respectively. The reporter is expressed by nanos promoter that drives germline expression in both sexes, thus enabling the examination of piRNA silencing of Burdock sequences independent of natural expression patterns of Burdock transposon. Scale bars, 20 µm.

