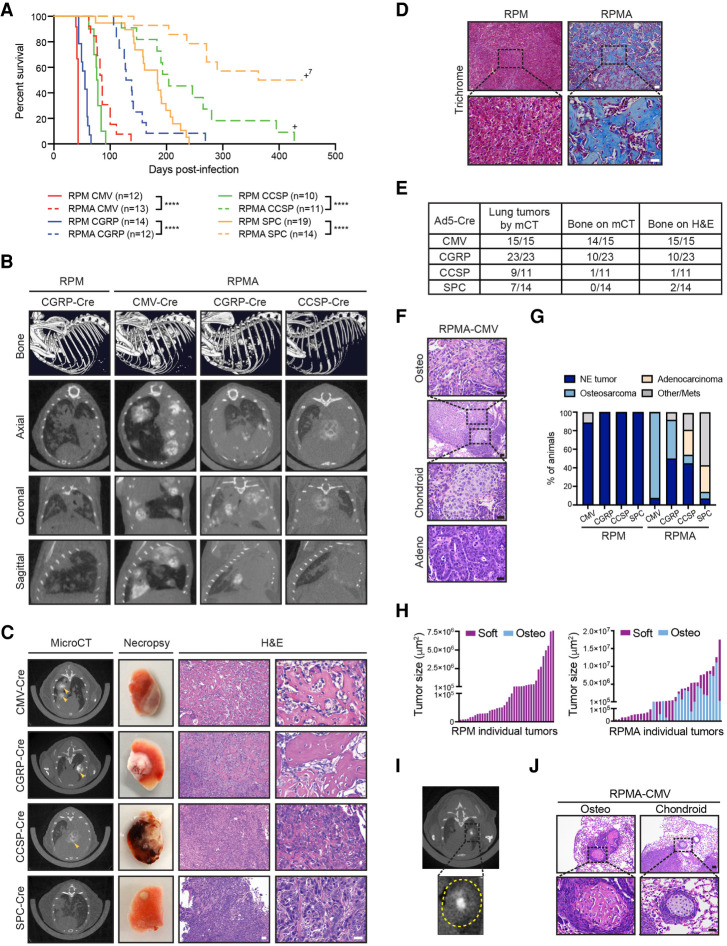
Figure 2.
ASCL1 loss delays tumorigenesis and promotes bone differentiation in multiple cells of origin. (A) Survival curve comparing RPM (solid lines; data from Fig. 1A) versus RPMA mice (dashed lines) infected with indicated cell type-specific Cre viruses. Number of mice indicated in the figure. (+)Mice censored to end the cohort. Mantel-Cox log-rank test, (****) P < 0.0001. (B, top row) Representative bone analysis of microCT images in RPM versus RPMA mice with advanced lung tumors infected with the indicated Ad-Cre viruses. (Bottom rows) Matched axial, coronal, and sagittal cross-sections of RPM and RPMA lungs used for bone analysis. Images were collected at the following time points postinfection: RPM-CGRP 49 d, RPMA-CMV 111 d, RPMA-CGRP 139 d, and RPMA-CCSP 204 d. (C) Representative microCT axial cross-sections, necropsy images, and H&E staining for tumors from RPMA mice infected with indicated Ad-Cre viruses. Images were from mice collected at the following time points postinfection: CMV 85 d, CGRP 138 d, CCSP 204 d, and SPC 204 d. In microCT panel, yellow arrowheads indicate areas of focal bone formation. Necropsy image shows one whole lung lobe. In H&E panels, scale bar indicates 50 µm in 10× image (left), and 25 µm in the 40× image (right). (D) Representative Trichrome staining in RPM-CMV (43 d postinfection) versus RPMA-CMV (111 d postinfection) tumors. Scale bars: 50 μm for 10× image (top), 25 μm for 40× image (bottom). (E) Table indicating number of RPMA mice per cohort with lung tumors detected by microCT imaging, bone detected by microCT, or bone detected by H&E review. (F) Representative H&E from indicated mouse with adenocarcinoma or osteosarcoma and chondroid differentiation in adjacent tumor areas. Scale bars: 50 μm for 10× image (second image from top), 25 μm for 40× images. (G) Percent of RPM and RPMA mice infected with indicated cell type-specific Cre viruses that succumbed to the indicated tumor histological type. RPMA animals had a mixture of tumor types in each animal but were scored based on the preponderance of tumor type and size. “Other/mets” include animals that were sacrificed without tumors to end the cohort or that succumbed due to lymph node or brain metastases. (H) Size of individual soft tissue tumors and osteosarcomas quantified from PAB-stained slides from a representative RPM-CMV or RPMA-CMV mouse. (I) Representative microCT image from an RPMA-CGRP mouse showing bone density within the center of a soft tissue mass; tumor circled with dashed yellow line in inset. (J) Representative H&E from indicated mouse with osteosarcoma or chondroid differentiation. Scale bar indicates 50 μm for 10× image (top) and 25 μm for 40× image (bottom). See also Supplemental Figure S2, Supplemental Table S1, and Supplemental Movies.

