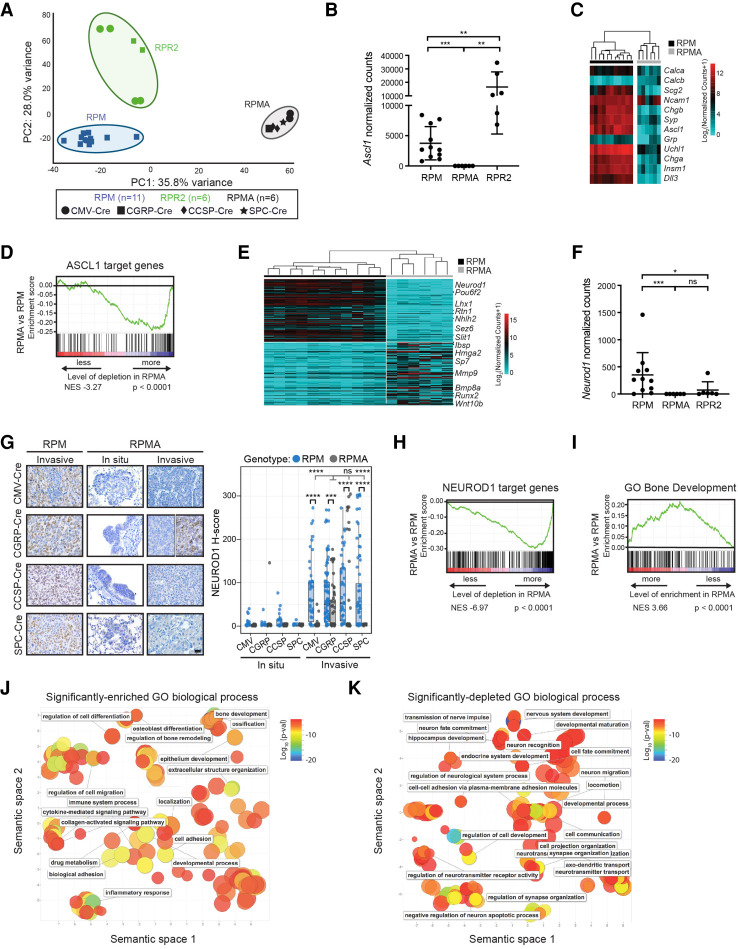
Figure 3.
RPMA tumors are transcriptionally distinct with loss of ASCL1 and NEUROD1 target genes. (A) Principal component (PC) analysis comparing gene expression by bulk RNA-seq in RPM, RPMA, and RPR2 tumors with Ad-Cre virus indicated in the figure. (B) Ascl1 expression shown as normalized counts by RNA-seq from lung tumors in indicated GEMMs. Mean ± SD. Mann-Whitney two-tailed t-test, (**) P < 0.01, (***) P < 0.0003. (C) Heat map comparing log2 normalized counts for expression of select neuroendocrine genes in RPM versus RPMA tumors. (D) Gene set enrichment analysis (GSEA) in RPMA versus RPM tumors using ASCL1 ChIP-seq target genes from Borromeo et al. (2016). Normalized enrichment score (NES) and P-value indicated in figure. (E) Heat map of top 200 (100 up and 100 down) differentially expressed genes in RPMA versus RPM tumors with select genes indicated. (F) Neurod1 expression as normalized counts by RNA-seq from lung tumors in indicated GEMMs. Mean ± SD. Mann-Whitney two-tailed t-test, (*) P < 0.05, (***) P < 0.001, (ns) not significant. (G) Representative IHC and H-score quantification for NEUROD1 in indicated tumors. Approximately 20–100 tumors were quantified from five to seven mice per condition. Images are from mice collected at approximately the following time points postinfection: RPM-CMV 43 d, RPM-CGRP 45 d, RPM-CCSP 80 d, RPM-SPC 185 d, RPMA-CMV in situ 85 d, RPMA-CMV invasive 95 d, RPMA-CGRP in situ 125 d, RPMA-CGRP invasive 180 d, RPMA-CCSP in situ 265 d, RPMA-CCSP invasive 220 d, RPMA-SPC in situ 290 d, and RPMA-SPC invasive 360 d. Scale bar, 25 µm. RPMA-CGRP IHC panel is split to indicate heterogeneity observed. Data from RPM in situ tumors are also shown in Supplemental Figure S1C. For box plots, the median and interquartile range are shown (top of box is 25th percentile, bottom of box is the 75th percentile). Gray statistics line bars indicate comparisons between RPMA models; black statistics line bars indicate comparisons between RPM and RPMA models initiated with the same virus. Mean ± SD. Mann-Whitney two-tailed t-test, (***) P = 0.0005, (****) P < 0.0001, (ns) not significant. (H) GSEA comparing RPMA versus RPM tumors using NEUROD1 ChIP-seq target genes from RPM tumors (n = 2) and human SCLC cell lines from Borromeo et al. (2016). Normalized enrichment score (NES) and P-value indicated in the figure. (I) GSEA comparing RPMA versus RPM tumor gene expression to a known ossification signature, “GO_Bone_Development.” NES and P-values are indicated in the figure. (J) Scatter plot visualizing semantic similarity of GO biological processes enriched in RPMA versus RPM tumors. (K) Scatter plot visualizing semantic similarity of GO biological processes depleted in RPMA versus RPM tumors.

