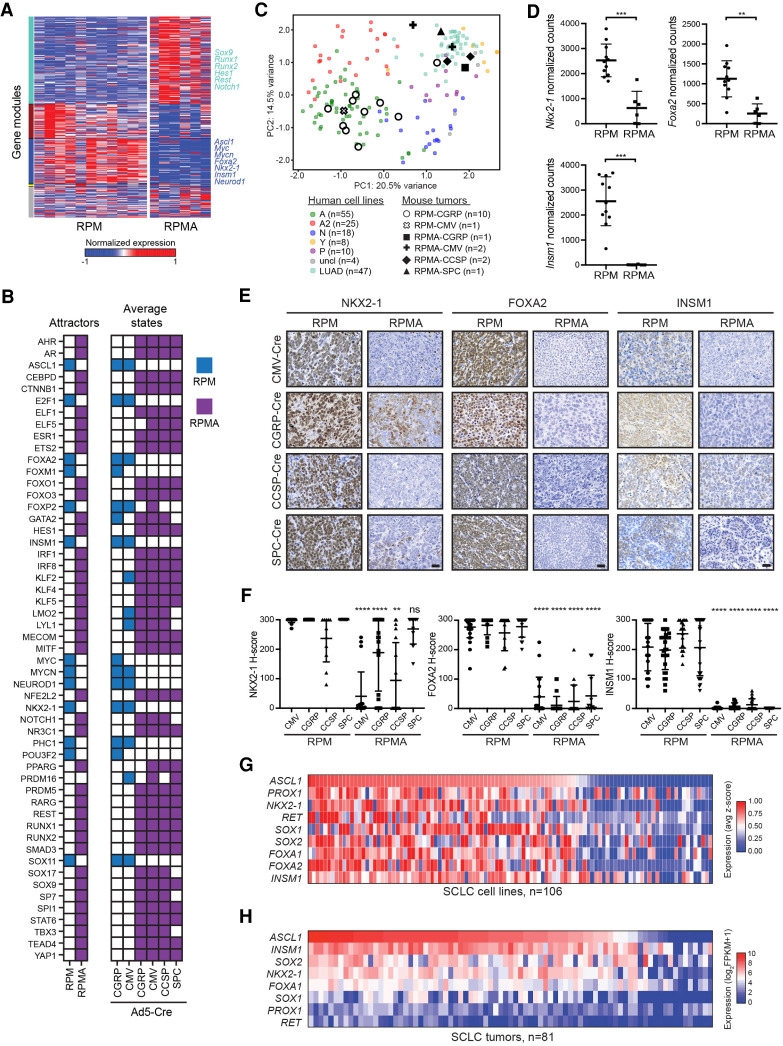
Figure 4.
Network analyses predict transcriptional regulators that drive osteosarcoma cell fate upon ASCL1 loss. (A) Weighted gene coexpression network analysis (WGCNA) reveals coexpressed gene modules (colored bars on the left Y-axis label) in RPM and RPMA tumors. (B) Binarized average states and state-attractors in RPM (blue) and RPMA (purple) tumors initiated with the indicated Cre viruses. For each gene, colored squares are ON and white squares are OFF. (C) Principal component (PC) analysis comparing bulk RNA-seq expression in human SCLC cell lines (SCLC lines from CCLE and cBioPortal and lung adenocarcinoma [LUAD] cell lines from CCLE) with mouse RPM or RPMA tumors initiated with the indicated viruses. Human SCLC cell lines were classified into subtypes based on high expression of ASCL1 (A and A2 variant), NEUROD1 (N), POU2F3 (P), or YAP1 (Y), or were unclassified (uncl). Mouse tumors were harvested at the following time points postinfection: RPM-CMV 55 d, RPM-CGRP 47–61 d, RPMA-CMV 85–86 d, RPMA-CGRP 111 d, RPMA-CCSP 120–204 d, and RPMA-SPC 204 d. (D) Normalized counts of indicated genes from RNA-seq in indicated GEMMs from C. Data are shown as mean ± SD. Mann-Whitney two-tailed t-test, (***) P < 0.001; (**) P < 0.01. (E) Representative IHC images for indicated antibodies in RPM and RPMA mice infected with cell type-specific Cre viruses. Images were collected from mice at approximately the following time points postinfection: RPM-CMV 43 d, RPM-CGRP 50 d, RPM-CCSP 85 d, RPM-SPC 190 d, RPMA-CMV 95 d, RPMA-CGRP 160 d, RPMA-CCSP 210 d, and RPMA-SPC 310 d. Scale bar, 25 µm. (F) H-Score IHC quantification for indicated proteins in RPM and RPMA tumors. Approximately five to 33 tumors were quantified from n = 3–5 mice per condition. Data are shown as mean ± SD. Mann-Whitney two-tailed t-test, (**) P < 0.01, (****) P < 0.0001, (ns) not significant. (G) Heat map derived from “SCLC-CellMinerCDB” showing relative expression of SCLC transcription factor genes compared with ASCL1. (H) Heat map showing relative expression of SCLC transcription factor genes in human tumors from George et al. (2015) compared with ASCL1. See also Supplemental Figure S3.

