Figure 5.
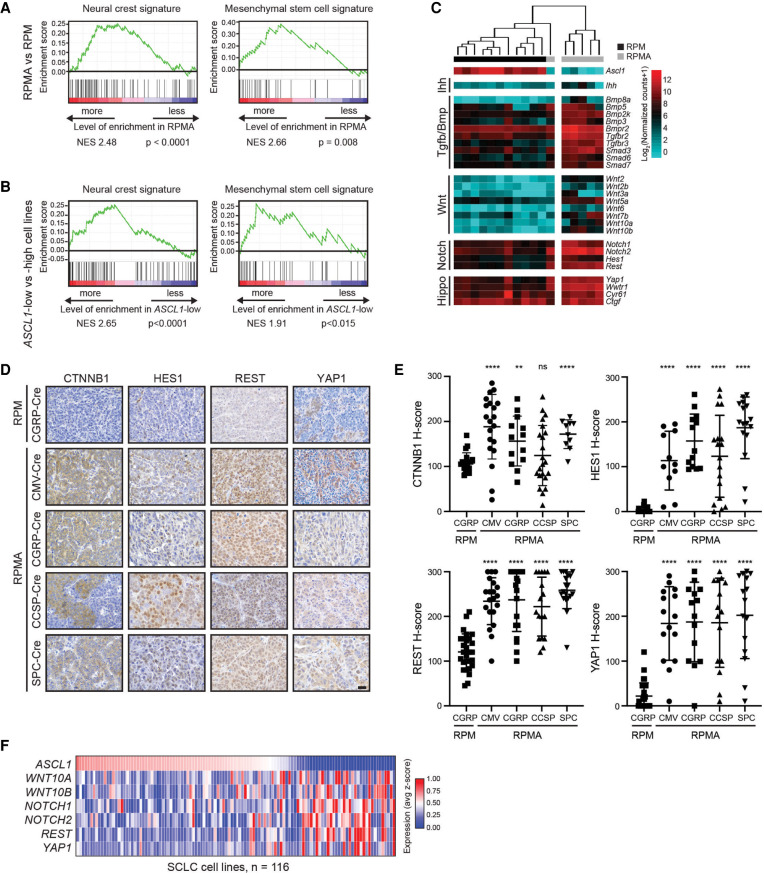
ASCL1 represses nonendodermal cell fates and Hippo/Notch/Wnt developmental pathways in MYC-driven SCLC. (A) GSEA in RPMA versus RPM tumors compared with neural crest and mesenchymal stem cell signatures. NES and P-values are indicated in the figure. (B) GSEA in ASCL1-low versus ASCL1-high human cell lines (SCLC-CellMinerCDB, where subtype status is defined by SCLC-CellMinerCDB) compared with neural crest and mesenchymal stem cell signatures. NES and P-values are indicated in the figure. (C) Heat map showing expression of indicated genes in RPM versus RPMA tumors analyzed by RNA-seq for components of the indicated developmental pathways. (D) Representative IHC for indicated antibodies (top) in RPM versus RPMA tumors initiated with the indicated cell type-specific Cre viruses (left). Images were collected from mice at approximately the following time points postinfection: RPM-CGRP, 50 d; RPMA-CMV, 95 d; RPMA-CGRP, 155 d; RPMA-CCSP, 215 d; and RPMA-SPC, 310 d. Scale bar, 25 μm. (E) H-score IHC quantification for indicated antibodies in D. Data are shown as mean ± SD. Approximately 11–28 tumors were used for quantification from three to five animals per condition. Mann-Whitney two-tailed t-test, (**) P < 0.01, (****) P < 0.0001, (ns) not significant. (F) Heat map derived from “SCLC-CellMinerCDB” with expression of selected genes in developmental pathways relative to ASCL1 in human SCLC cell lines. See also Supplemental Figure S4.

