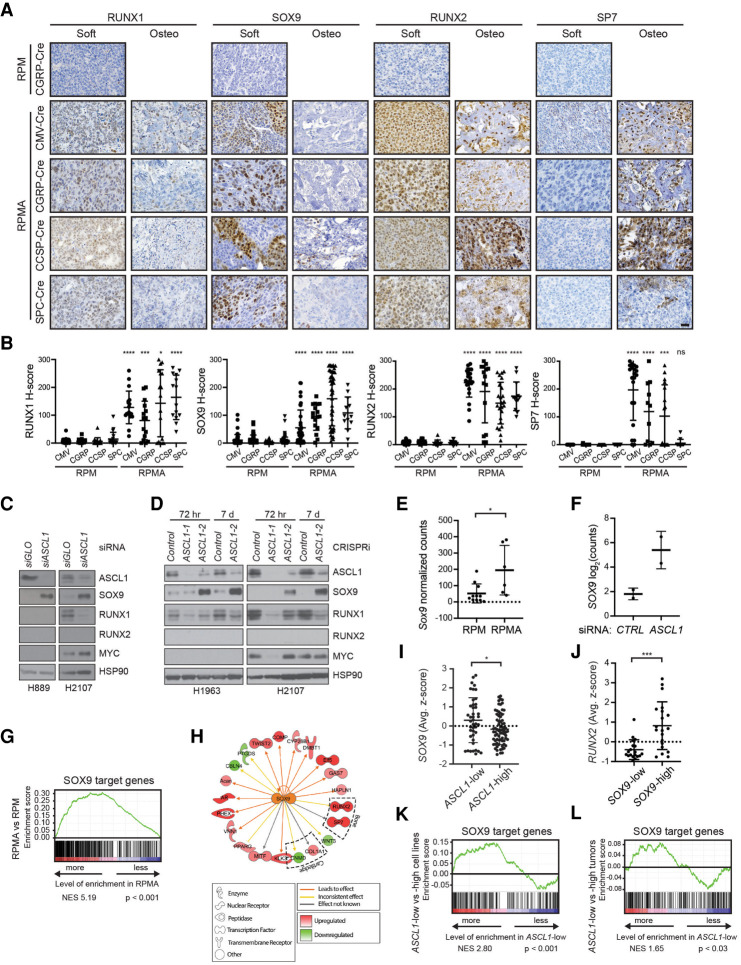
Figure 6.
ASCL1 represses SOX9 in mouse and human SCLC tumor cells. (A) Representative IHC for indicated antibodies (top) in RPM versus RPMA tumors initiated with the indicated cell type-specific Cre viruses (left). RPMA tumors were classified as noncalcified tumors (soft) or osteosarcomas (osteo). Images were collected from mice at approximately the following time points postinfection: RPM-CGRP, 55 d; RPMA-CMV, 85 d; RPMA-CGRP, 150 d; RPMA-CCSP, 215 d; and RPMA-SPC, 310 d. Scale bar, 25 μm. (B) H-score quantification for the indicated proteins in RPM versus RPMA tumors from A. Data are shown as mean ± SD and include both soft and osteo tumors. Approximately 11–85 tumors from three to six mice per condition were quantified. Mann-Whitney two-tailed t-test, (*) P < 0.05, (***) P < 0.001, (****) P < 0.0001, (ns) not significant. (C) Representative immunoblot following 72 h treatment with control (CTRL) or ASCL1 siRNAs in the indicated human SCLC cell lines. HSP90 serves as loading control. (D) Representative immunoblot following stable infection with dCas9-KRAB for CRISPRi-mediated vector control or ASCL1 repression in the indicated human SCLC cell lines at indicated time points. Cells with ASCL1-1 were dying at 72 h and dead by 7 d. HSP90 serves as loading control. (E) Sox9 expression as normalized counts by RNA-seq from lung tumors in indicated GEMMs. Mean ± SD. Two-tailed t-test, (*) P < 0.05. (F) SOX9 expression by RNA-seq from human SCLC cell line NCI-H2107 treated for 72 h with control (CTRL) or ASCL1 siRNAs performed in biological duplicate. Results are reported as log2 normalized counts with mean ± SD. (G) GSEA for SOX9 target genes from Larsimont et al. (2015), in RPMA versus RPM tumors. NES and P-values indicated in the figure. (H) Predicted SOX9 target genes enriched or depleted in RPMA versus RPM tumors by IPA. (I) SOX9 expression in human SCLC cell lines grouped by ASCL1 expression levels in “SCLC-CellMinerCDB.” Data are shown as average z-score ± SD. Mann-Whitney two-tailed t-test, (*) P < 0.05. (J) RUNX2 expression in human SCLC cell lines grouped by SOX9 expression levels in “SCLC-CellMinerCDB.” Data are shown as average z-score ± SD. Mann-Whitney two-tailed t-test, (***) P = 0.0005. (K) GSEA for SOX9 target genes from Larsimont et al. (2015), in ASCL1-low versus ASCL1-high human SCLC cell lines from SCLC-CellMinerCDB, where ASCL1 subtype is defined by SCLC-CellMinerCDB. NES and P-values are indicated in the figure. (L) GSEA for SOX9 target genes from Larsimont et al. (2015), in ASCL1-low versus ASCL1-high human tumors from George et al. (2015). NES and P-values are indicated in the figure. ASCL1 status defined by analysis in Irelend et al. (2020). See also Supplemental Figure S5.

