Figure 1.
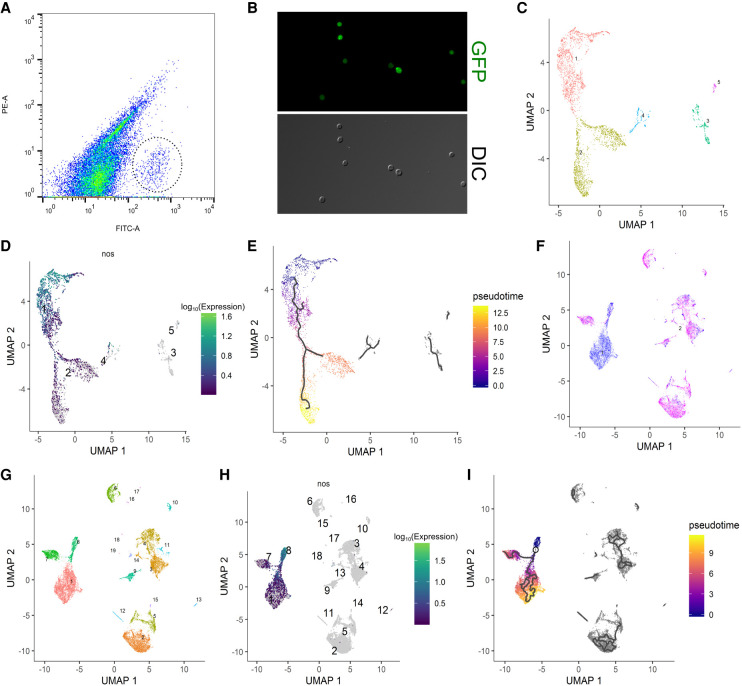
Clustering and pseudotime analysis of single-cell germline transcriptomes. (A) FACS plot for sorting germ cells from embryonic homogenates of 0- to 8-h embryos with the GFP+ germ cells highlighted by a dotted circle. x-axis is the green channel. (B) Morphology by DIC and GFP profiles of sorted 0- to 8-h germ cells in the unsexed sample. Note that virtually all cells recovered are GFP-positive cells whose morphology resembles that of germline. (C) Clustering analysis of the unsexed sample. Each dot represents a cell in the data set, and individual clusters are numbered and colored differently. (D) Expression profile of nos of the unsexed sample showing that clusters 1 and 2 make up the main germline cluster. Each dot represents a cell in the data set, the numbers indicate individual clusters, and the color code for expression levels is indicated on the right. (E) Pseudotime analysis of the germline cluster from the unsexed sample. The black lines within the clusters indicate pseudotime trajectories. The legend on the right explains the color code of pseudotime. (F) The sexed data set is plotted after dimension reduction. Each blue and magenta dot represents a cell from the male and female data set, respectively. (G) Clustering analysis of the sexed sample. Each dot represents a cell in the data set, and individual clusters are numbered and colored differently. (H) Expression profile of nos after clustering analysis of the sexed data set indicating that clusters 1, 7, and 8 contain germ cells. Details of the graph are the same as in D. (I) Pseudotime analysis of the germline cluster from the sexed data set. Black lines indicate pseudotime trajectories and the color codes of pseudotime are indicated on the right.

