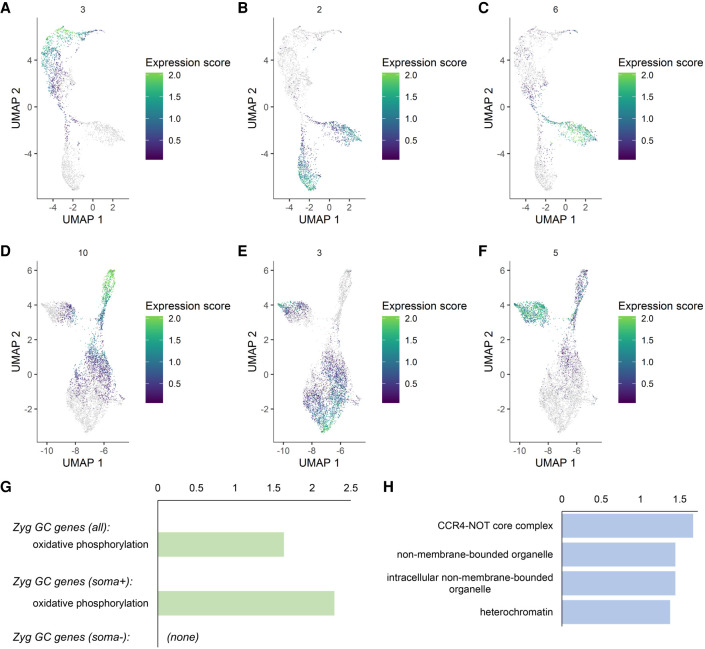
Figure 2.
Expression trends in the germline clusters and activation of the zygotic germline genome. (A–F) Expression modules in the unsexed (A–C) and sexed (D–F) samples indicating patterns of maternal contribution (A,D), zygotic activation (B,E), and female-biased expression (C,F). Module numbers and color codes are on the top and to the right of each graph, respectively. (G) KEGG pathway enrichment results for the genes activated in the zygotic germline. The upper bar shows the enrichment term found for all zygotic genes together and the lower bar is for those that are soma-positive. There were no terms found to be enriched for the soma-negative genes. (H) GO-Term: Cellular Components enrichment analysis for the zygotic soma-negative germline genes. (G,H) The x-axes indicate −log(p) values.

