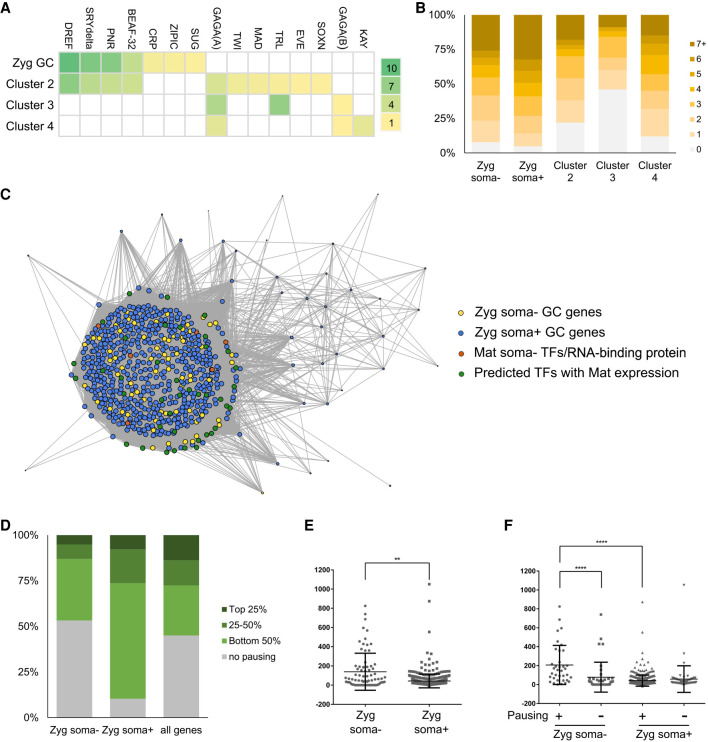
Figure 3.
Regulation of early germline-specific expression. (A) Heat map display of TF binding site enrichment analysis for all zygotic germline genes and markers of somatic clusters 2–4. The names of TFs are listed on the top and the scale on the right indicates the –log(p) values for each entry. (B) Numbers of binding sites found in the promoter regions of zygotic germline genes or markers of somatic clusters for TFs enriched in the germline. (C) Network view of pairwise expression correlation values in the germline cluster of the unsexed data set between genes of the following four groups with one another: zygotic soma-negative germline genes (yellow dots), zygotic soma-positive germline genes (blue dots), maternally deposited soma-negative TFs and RNA-binding protein genes (orange dots), and TFs identified through our enrichment analyses with detectable maternal expression in germ cells (green dots). Only correlations >0.5 are displayed, the sizes of dots indicate the numbers of correlations each gene has above the 0.5 cutoff, and the lengths of the connection lines inversely reflect the correlation values between a pair of genes. (D) Polymerase pausing of zygotic germline genes in the early embryonic soma based on a study from Saunders et al. (2013). Genes are categorized based on their pausing index into top 25%, 25%–50%, bottom 50%, or no pausing groups. We present the comparisons between soma-negative zygotic germline genes, soma-positive zygotic germline genes, and all genes in the genome. (E) Test of RNA stability in the soma using ratios of nascent RNA levels in the gene body regions to steady-state RNA levels of various genes. The middle horizontal lines indicate the means calculated for the soma-negative and soma-positive groups of genes, whereas the top and bottom horizontal lines mark the standard deviations. (**) P < 0.005. (F) Comparisons of RNA stability between the soma-negative and -positive zygotic germline genes that exhibit pausing and not. The values were calculated as in E. (****) P < 0.0001.

