Figure 4.
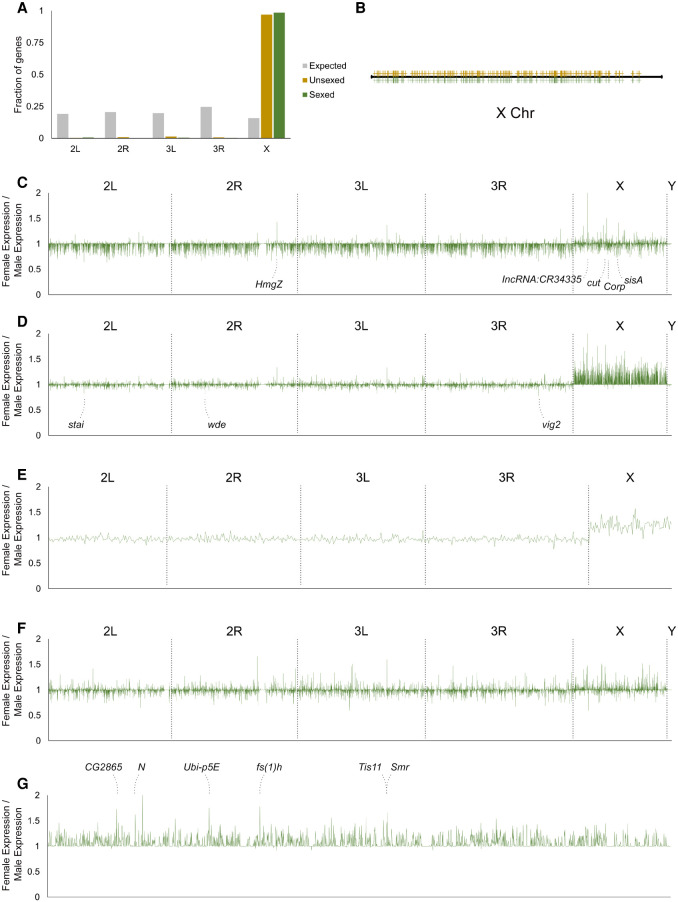
Analyses of sex differences in the early germline. (A) Chromosomal distribution of genes from the female-enriched expression modules. The fraction of genes belonging to each chromosome is plotted. Gray bars, expected distribution based on number of genes on each chromosome; yellow bars, distribution of genes from the unsexed sample; green bars, distribution of genes from the sexed sample. (B) Distribution of X Chromosome genes from female-enriched expression modules along the X Chromosome. The yellow and green marks designated genes from the unsexed and sexed data sets, respectively. (C) Differences in expression levels of all genes between female and male germ cells prior to the bifurcation point of the germline cluster from the adjusted sexed data set in which male reads were reduced randomly by 25%. The x- and y-axes are the same for C–F: the x-axes plot the positions on individual chromosomes as indicated and the y-axes plot the fold differences of expression of female germ cells over male germ cells. The identities of the most female-biased genes are indicated. (D) Differences in expression levels of all genes between female and male germ cells after they bifurcate in the germline cluster from the adjusted sexed data set. The gene names of the most male-biased peaks are indicated. (E) Expression differences of the 647 zygotically activated germline genes between the two sexes based on the adjusted sexed data set. (F) Female-to-male expression ratio of all genes of somatic cells included in the adjusted sexed sample. (G) Female-to-male expression ratios of X Chromosome genes of germ cells after bifurcation from the adjusted sexed data set. The identities of the highest peaks are indicated.

