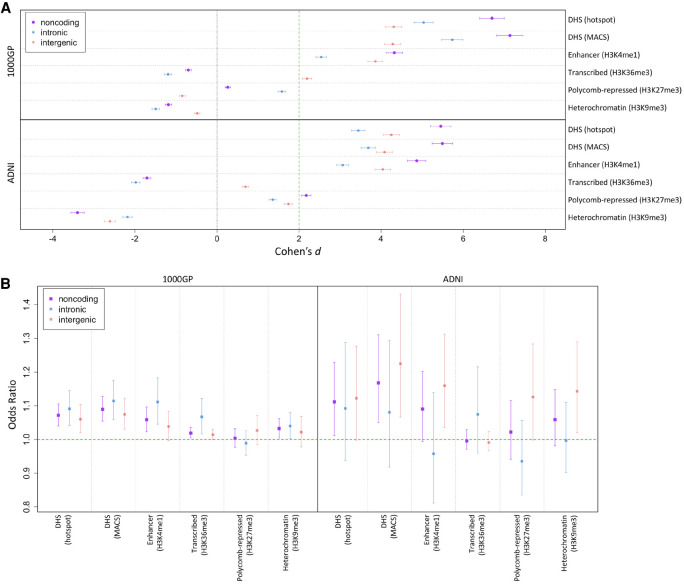
Figure 2.
Depletion of deletions and shift of deletion allele frequency (AF) spectrum (AFS) overlapping regulatory sites. (A) We calculated PlyRSsum for every deletion to quantify overlap with sites of chromatin accessibility or histone modification. We plot the degree of reduction in the PlyRSsum for real deletions relative to simulation. This reduction is measured using Cohen's d, which is the effect size of a t-test on PlyRSsum values in units of SD (plotted with 95% confidence intervals [CIs] showing the uncertainty owing to the finite number of simulations). Two units of effect size (Cohen's d = 2) approximately correspond to the 95% CI of significance in depletion. Higher values of Cohen's d indicate larger depletion within those sets compared with simulation. In presence of the true effect, there is a sample-size dependence on the underlying t-test, and the expected value of Cohen's d would be higher for larger data sets. (B) For each deletion, we determined the magnitude of PlyRSsum depletion, calculated as a ratio between its PlyRSsum and the average PlyRSsum of its length-matched simulated counterparts, for sites of chromatin accessibility or histone modification. We tested whether PlyRSsum depletion magnitude depends on AF (deletions categorized as rare [AF ≤ 1%] or common), using multivariate logistic regression in the presence of genomic covariates. We plot the regression odds ratio with 95% profile likelihood-based CIs. Results above one indicate a positive correlation of the magnitude of PlyRSsum depletion with AF. This corresponds to an excess of rare alleles overlapping the regulatory feature in the real data set compared with simulation, which is the expected result for features being preserved by the action of purifying selection against overlapping deletions.

