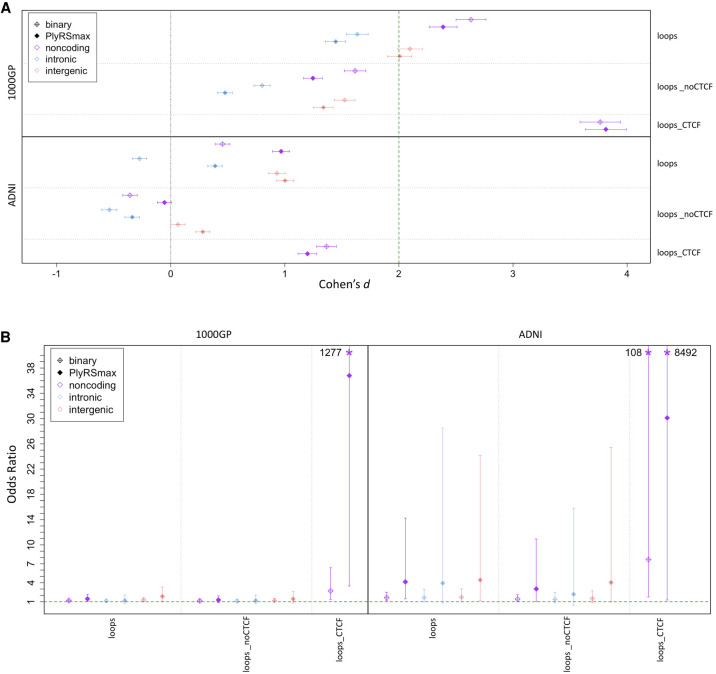
Figure 4.
Depletion of deletions and shift of AFS overlapping chromatin loop anchor sites. (A) We calculated a binary variable and PlyRSmax for every deletion to quantify overlap with loop sites. We plot the degree of reduction in the binary variable (or PlyRSmax) for real deletions relative to simulation measured using Cohen's d (with 95% CIs showing the uncertainty owing to the finite number of simulations). (B) For each deletion, we determined the magnitude of binary variable (or PlyRSmax) depletion, calculated as the difference between the binary variable (or PlyRSmax) and the average binary variable (or PlyRSmax) of its length-matched simulated counterparts, for loop sites. We tested whether binary variable (or PlyRSmax) depletion magnitude depends on AF (deletions categorized as rare [AF ≤ 1%] or common), using multivariate logistic regression in the presence of genomic covariates. We plot the regression odds ratio with 95% profile likelihood-based CIs. Asterisks denote odds ratio CIs that extend above the plotted y-axis, with values as indicated.

