Figure 1.
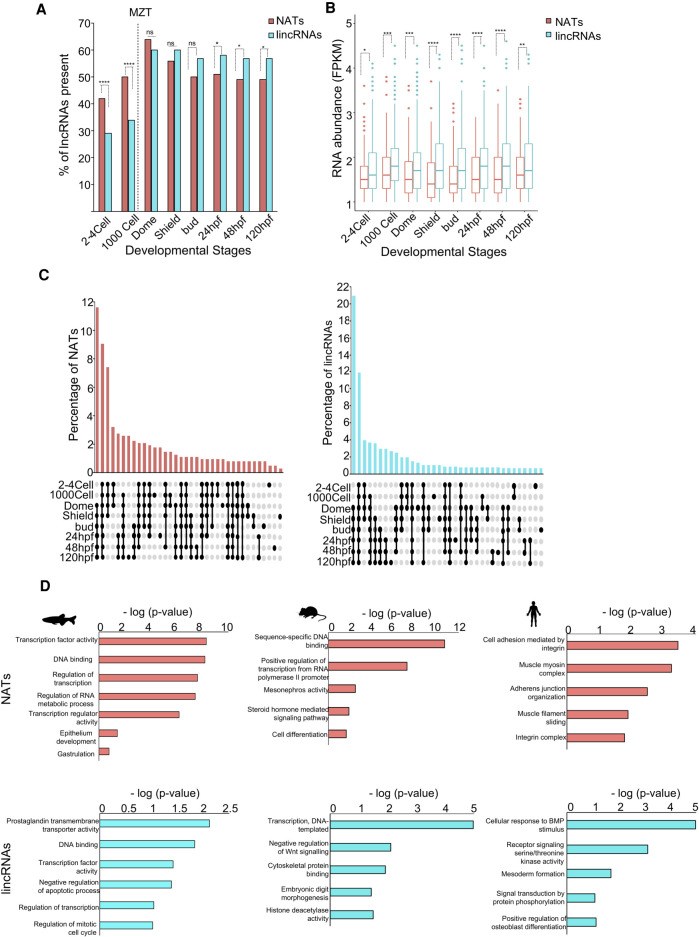
LncRNA dynamics during zebrafish development. (A) A bar plot showing the percentage of antisense and lincRNAs present during eight stages of zebrafish development. The significance values are as follows: (*) P < 0.05; (**) P < 0.005; (***) P < 0.001; (****) P < 0.0001; (ns) nonsignificant (χ2 test). (B) A box plot of abundance levels of NATs and lincRNAs across eight developmental stages. Each box shows median abundance value (as horizontal lines) and extend from 25th to 75th percentile values for each group. The outliers are shown as dots. The significance values are as follows: (*) P < 0.05; (**) P < 0.005; (***) P < 0.001; (****) P < 0.0001; (ns) nonsignificant (unpaired, two-tailed t-test). (C) UpSet diagrams depicting the percentage of NATs (left) and lincRNAs (right) that are common or unique in the eight stages of zebrafish development. The percentage of lncRNAs is shown on the y-axis, and the stages in which the lncRNA is present is shown below the x-axis. Filled circles represent the stages under consideration for the bar above. (D) Bar plots showing Gene Ontology terms associated with the mRNAs that overlap NATs (top) versus mRNAs neighboring to the lincRNAs (bottom) in zebrafish, mouse, and human. The −log(P-value) values for gene enrichment are plotted on the x-axis, and Gene Ontology terms are shown on the y-axis.

