Figure 3.
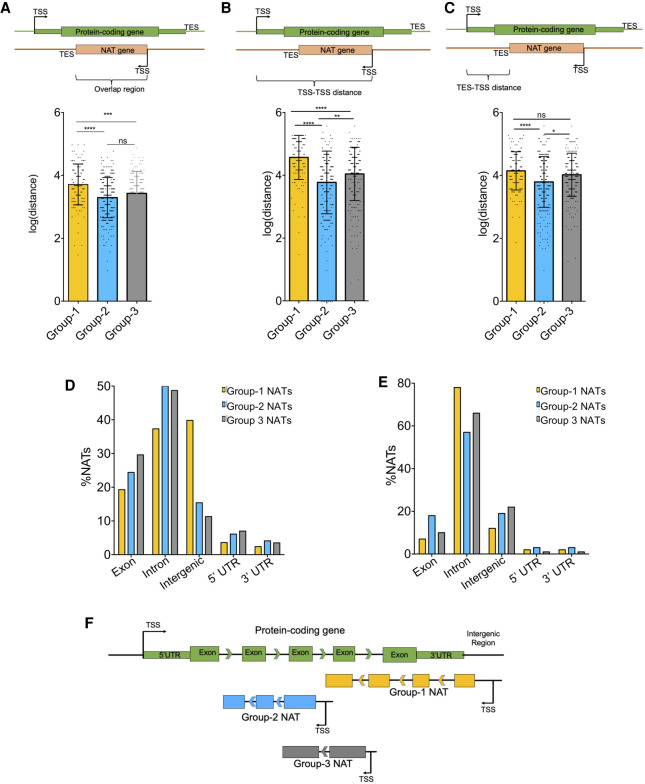
The NATs in three categories are differently transcribed vis-à-vis overlapping protein-coding genes. (A) A bar chart showing the overlap region between NATs and overlapping mRNAs in Group 1 (yellow), Group 2 (blue), and Group 3 (gray). (B) A bar chart showing the distance between the TSS of NATs and the TSS of overlapping mRNAs (log of distance in bp) in Group 1 (yellow), Group 2 (blue), and Group 3 (gray). (C) A bar chart showing the distance between the TES of NATs and the TSS of overlapping mRNA (log) in the Group 1 (yellow), Group 2 (blue), and Group 3 (gray). For A, B, and C, the schematic above each figure represents how the values were calculated. The bar values represent the mean ± standard deviation. The scatter shows individual values. The significance values are as follows: (*) P < 0.05; (**) P < 0.005; (***) P < 0.001; (****) P < 0.0001; (ns) nonsignificant (unpaired, two-tailed t-test). (D) A bar plot of the percentage of NAT TSSs overlapping different genomic features (exon, intron, intergenic region, 5′ UTR, and 3′ UTR) on the opposite strand. (E) A bar plot of the percentage of NAT TESs overlapping different genomic features (exon, intron, intergenic region, 5′ UTR, and 3′ UTR) on the opposite strand. (F) Schematic diagram representing how three different groups of NATs are distributed and localized in the genome with respect to the overlapping protein-coding genes.

