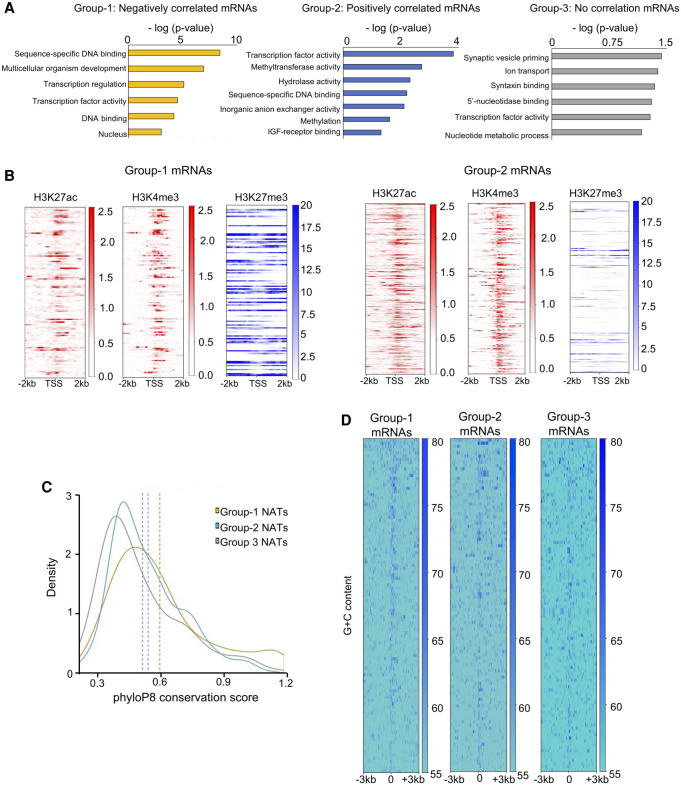
Figure 4.
Negatively correlated NATs overlap protein-coding genes involved in vertebrate development. (A) Bar plots depicting the Gene Ontology terms associated with mRNAs in the three categories of NAT protein-coding pairs. In each case, the x-axis displays −log(P-value) for Gene Ontology terms that are shown on the y-axis. (B) Heatmaps displaying the distribution of ChIP-seq reads for H3K27ac (red), H3K4me3 (red), and H3K27me3 (blue) histone modifications across the TSS of mRNAs overlapping Group 1 and Group 2 NATs. (C) Density plots showing the conservation score (phyloP8) at the promoters of mRNAs. Group 1 mRNAs are more conserved in comparison to the other two groups. (D) Heatmaps displaying G + C content at the promoters of mRNAs in the three categories.

