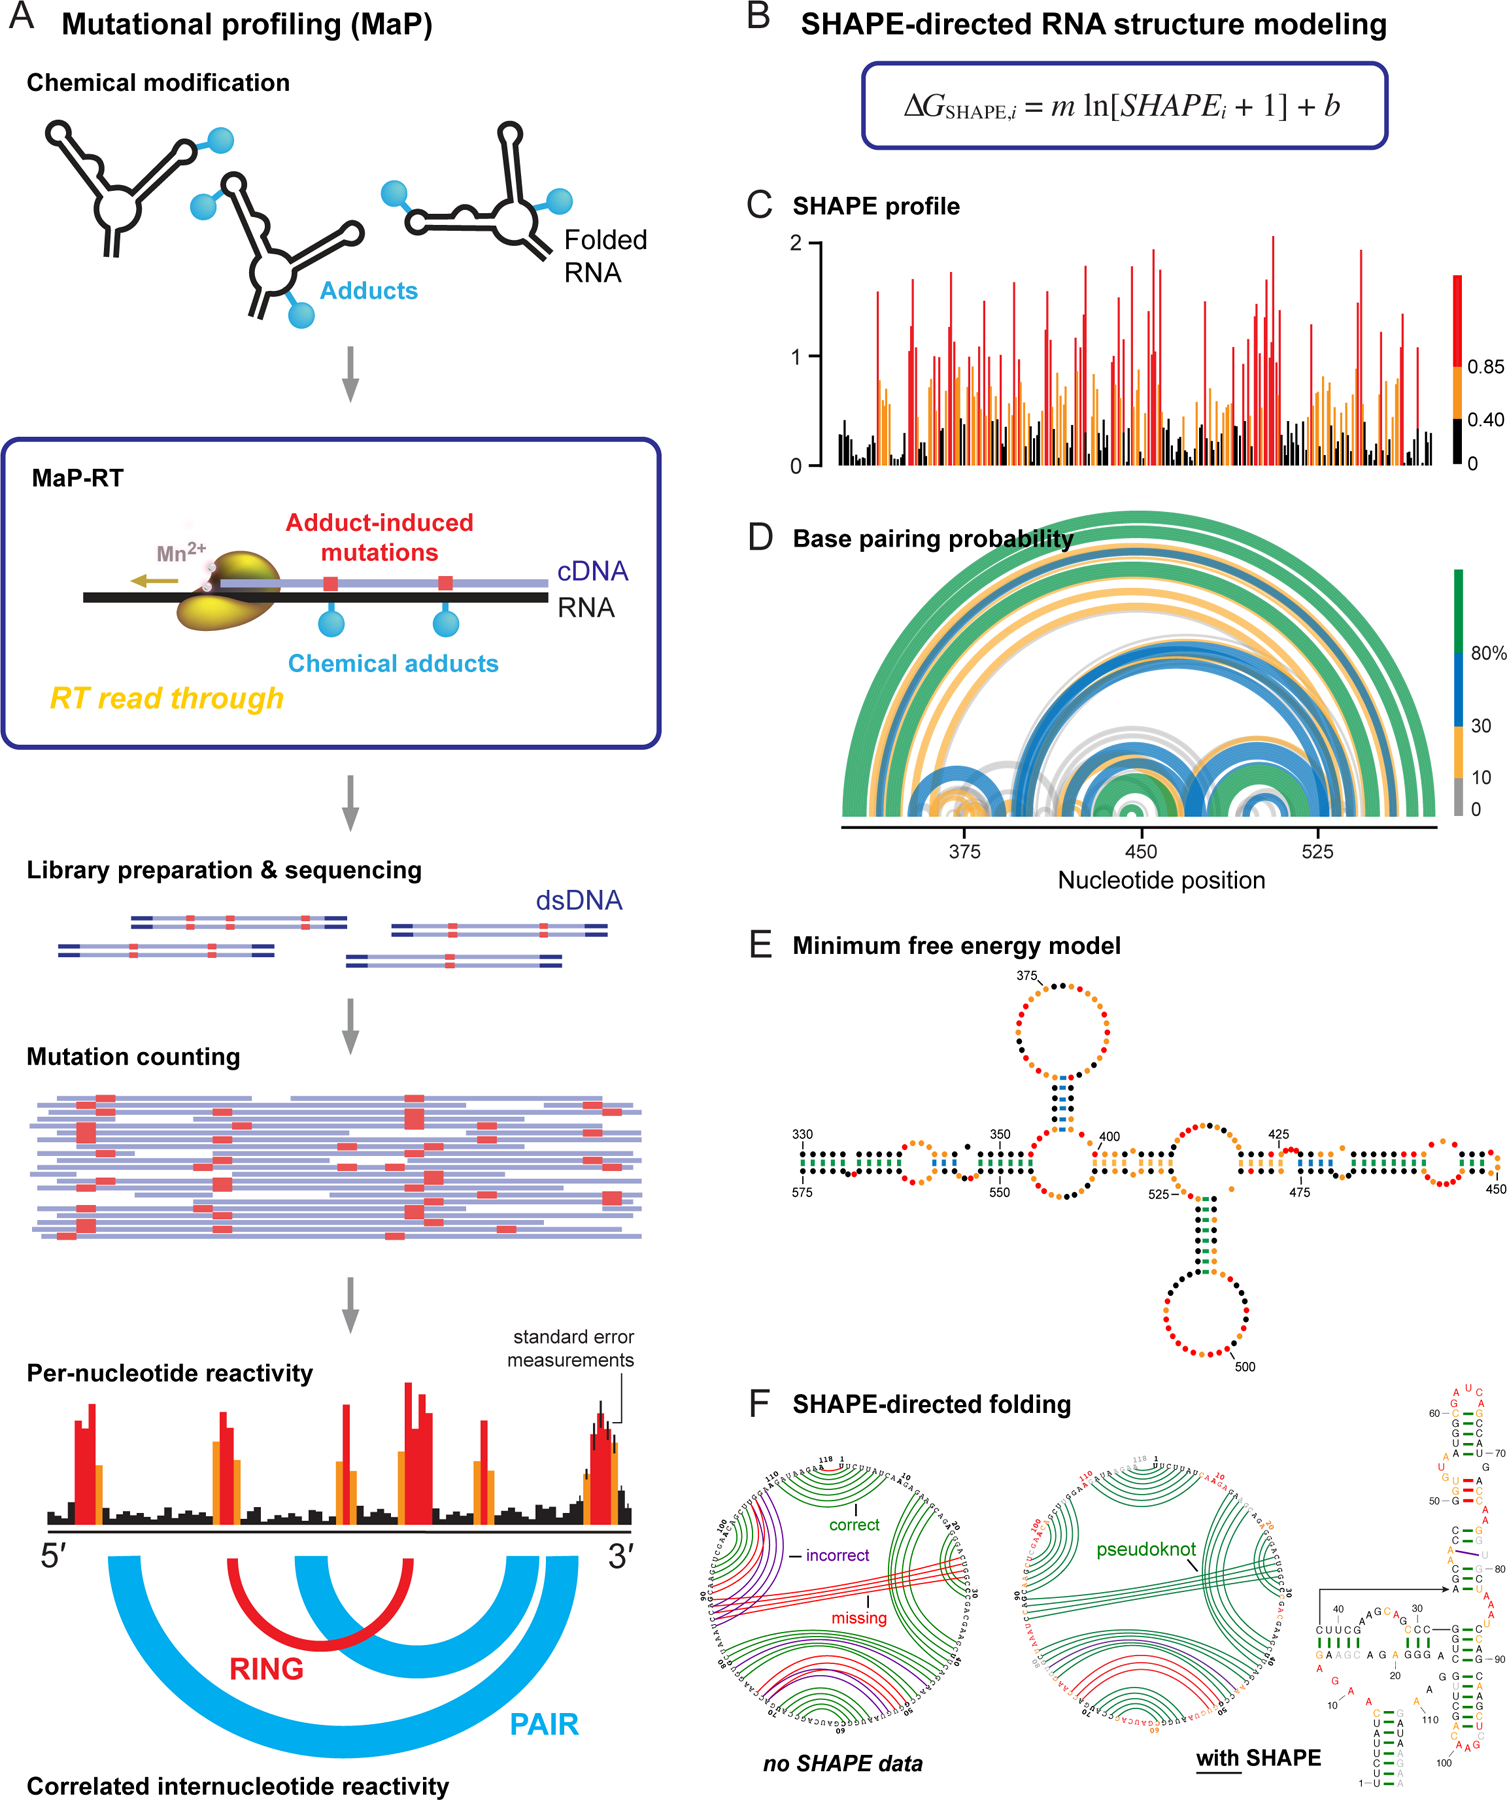
Figure 3.

Overview of SHAPE, MaP, and RNA structure modeling. (A) Mutational profiling. RNA is treated with a reagent that reports secondary or tertiary structure; relaxed fidelity reverse transcription records chemical adducts as mutations relative to the original sequence (in red) internally in the cDNA; cDNAs are sequenced; and reads are aligned and used to create reactivity profiles. Data may be interpreted on a per-nucleotide basis or as through-space internucleotide correlations. (B) The ∆GSHAPE pseudo-free energy change relationship that enables SHAPE-directed structure modeling. (C) Per-nucleotide reactivity profile for a domain of the STMV RNA genome56,91. (D, E) Secondary structure models (based on data in panel C) shown as (D) probability arc plots and (E) minimum free energy secondary structure diagram. In probability arcs and lines connecting base pairs, colors indicate the likelihood of unique pairing for a given nucleotide. (F) Representative secondary structure modeling, showing the SAM-I riboswitch21 (left) without and (right) with SHAPE data. SHAPE-directed modeling often yields dramatic improvements, including for RNAs containing pseudoknots. Arcs indicate correct (green), incorrect (purple), and missing (red) pairs, relative to accepted structure.
