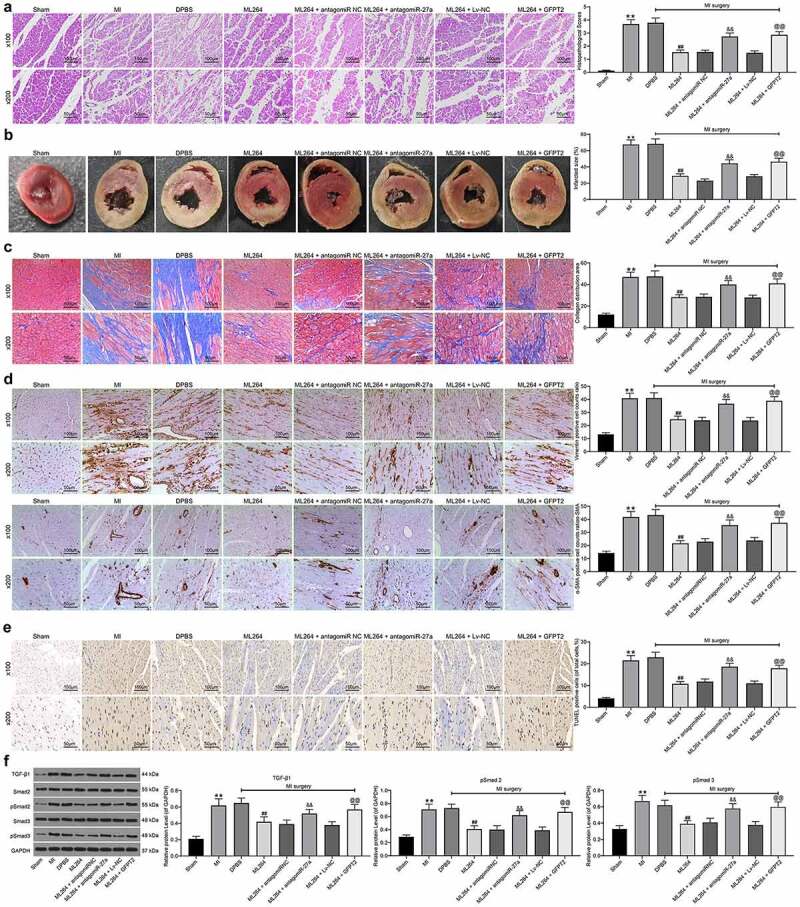
Figure 8.

KLF5/miR-27a/GFPT2 axis mediates the TGF-β/Smad2/3 signaling pathway to affect MI progression in mice. A, pathological structure in mouse myocardial tissues determined by HE staining (one-way ANOVA, ** p < 0.01 vs Sham, ## p < 0.01 vs DPBS; && p < 0.01 vs ML264 + antagomiR NC; @@ p < 0.01 vs ML264 + Lv-NC); B, infarct size in mouse myocardial tissues determined by TTC staining (one-way ANOVA, ** p < 0.01 vs Sham, ## p < 0.01 vs DPBS; && p < 0.01 vs ML264 + antagomiR NC; @@ p < 0.01 vs ML264 + Lv-NC); C, fibrosis in myocardial tissues evaluated by Masson’s trichrome staining (one-way ANOVA, ** p < 0.01 vs Sham, ## p < 0.01 vs DPBS; && p < 0.01 vs ML264 + antagomiR NC; @@ p < 0.01 vs ML264 + Lv-NC); D, expression of Vimentin and α-SMA in myocardial tissues detected by immunohistochemistry staining (one-way ANOVA, ** p < 0.01 vs Sham, ## p < 0.01 vs DPBS; && p < 0.01 vs ML264 + antagomiR NC; @@ p < 0.01 vs ML264 + Lv-NC); E, cell apoptosis in mouse myocardial tissues determined by TUNEL assay (one-way ANOVA, ** p < 0.01 vs Sham, ## p < 0.01 vs DPBS; && p < 0.01 vs ML264 + antagomiR NC; @@ p < 0.01 vs ML264 + Lv-NC); F, TGF-β expression and phosphorylation of Smad2/3 in mouse myocardial tissues determined by western blot analysis (one-way ANOVA, ** p < 0.01 vs Sham, ## p < 0.01 vs DPBS; && p < 0.01 vs ML264 + antagomiR NC; @@ p < 0.01 vs ML264 + Lv-NC). There were 10 mice in each group. Data were exhibited as mean ± SD from at least three independent experiments
