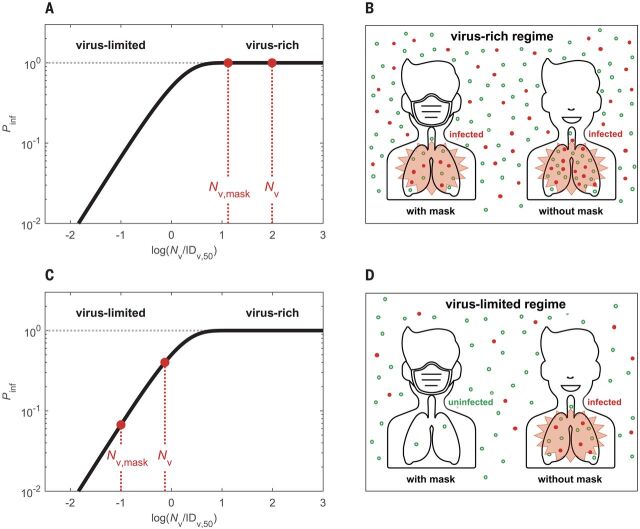
Fig. 1. Schematic illustration of different regimes of abundance of respiratory particles and viruses.
(A to D) The solid curves represent the infection probability (Pinf) as a function of inhaled virus number (Nv) scaled by median infectious dose IDv,50 at which Pinf = 50%. In the virus-rich regime [(A) and (B)], the concentration of airborne viruses is so high that both the numbers of viruses inhaled with and without masks (Nv,mask, Nv) are much higher than IDv,50, and Pinf remains close to ~1 even if masks are used. In the virus-limited regime [(C) and (D)], Nv and Nv,mask are close to or lower than IDv,50, and Pinf decreases substantially when masks are used, even if the masks cannot prevent the inhalation of all respiratory particles. In (B) and (D), the red dots represent respiratory particles containing viruses, and the open green circles represent respiratory particles without viruses. Man icon used in (B) and (D) was made by Tinu CA from www.freeicons.io, distributed under CC-BY 3.0.

