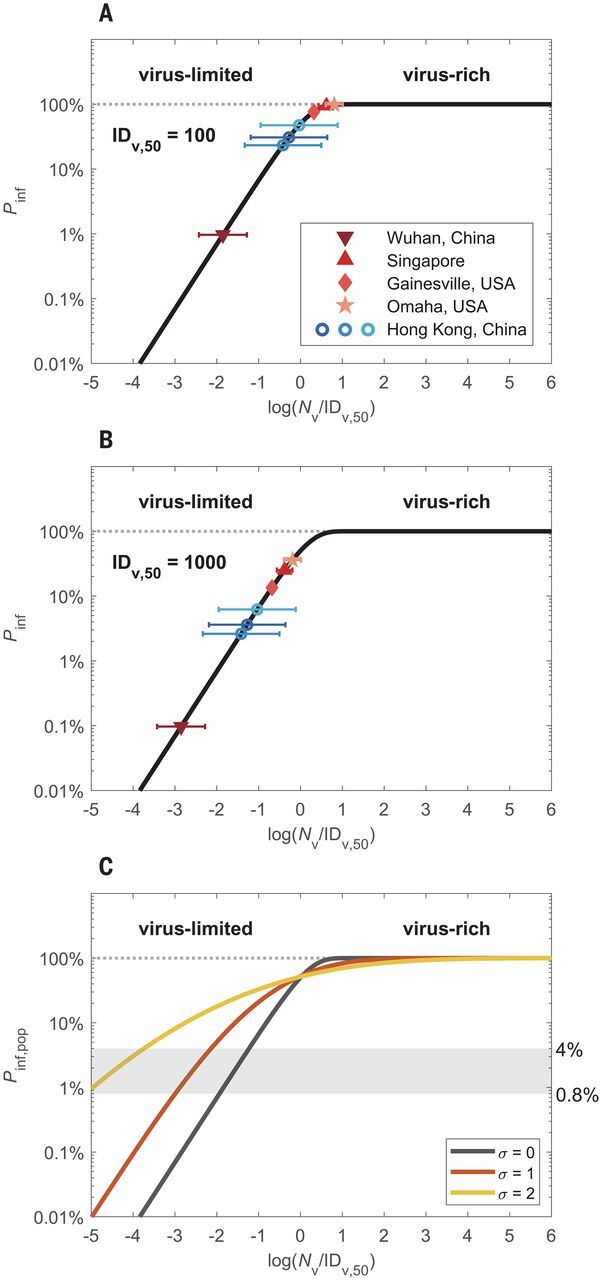
Fig. 2. Infection probabilities and abundance regimes of SARS-CoV-2 and other respiratory viruses.

(A and B) Individual infection probabilities (Pinf) plotted against inhaled virus number (Nv) scaled by characteristic median infectious doses of IDv,50 = 100 or 1000 viruses, respectively. The colored data points represent the mean numbers of viruses inhaled during a 30-min period in different medical centers in China, Singapore, and the US, according to measurement data of exhaled coronavirus, influenza virus, and rhinovirus numbers (blue circles) (11) and of airborne SARS-CoV-2 number concentrations (red symbols) (15–18), respectively. The error bars represent one geometric standard deviation. (C) Population-average infection probability (Pinf,pop) curves assuming lognormal distributions of Nv with different standard deviations of σ = 0, 1, and 2, respectively. The x axis represents the mean value of log(Nv/IDv,50). The shaded area indicates the level of basic population-average infection probability, Pinf,pop,0, for SARS-CoV-2, as calculated from the basic reproduction number for COVID-19 and estimated values of average duration of infectiousness and daily number of contacts.
