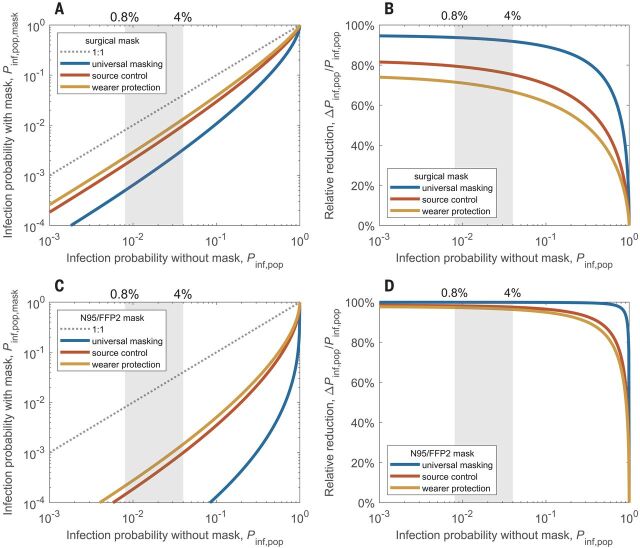
Fig. 3. Reduction of airborne transmission by face masks worn by infectious persons only (source control), by susceptible persons only (wearer protection), or by all persons (universal masking).
(A and B) Population-average infection probability in case of mask use (Pinf,pop,mask) plotted against infection probability without face masks (Pinf,pop) (A) and corresponding mask efficacy—i.e., relative reduction of infection probability, ΔPinf,pop/Pinf,pop—plotted against Pinf,pop for surgical masks (B). (C and D) Same as (A) and (B) but for N95 or FFP2 masks; plots with linear scaling are shown in fig. S8. The lines represent the results obtained for source control (red line), wearer protection (yellow line), and the combination of both measures, i.e., universal masking, (blue line) in a population where the virus exposure is lognormally distributed with a standard deviation of σ = 1 (supplementary text, section S5). The shaded areas indicate the level of basic population-average infection probability, Pinf,pop,0, corresponding to the basic reproduction number for COVID-19.

