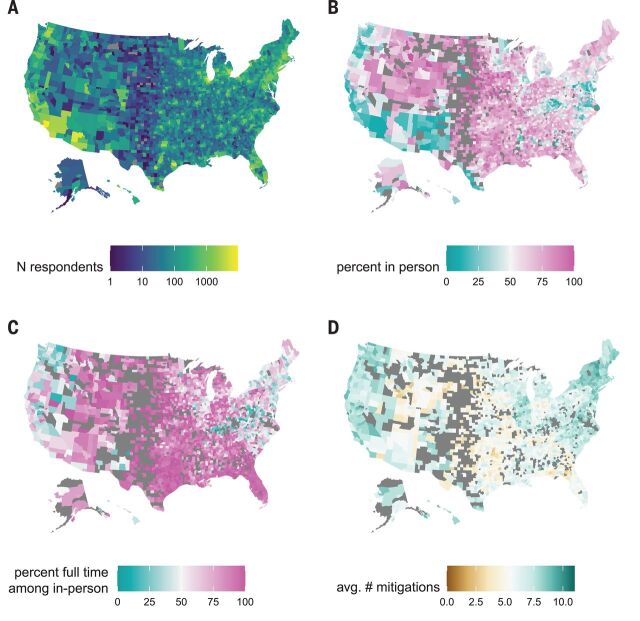
Fig. 1. Spatial distribution of survey responses.
(A) Number of survey respondents reporting a school-aged student in the household by county. (B) Percentage of households with school-aged children reporting any in-person schooling by county, excluding counties with fewer than 10 responses (excluded counties are shown in dark gray). (C) Percentage of households reporting a child in in-person schooling who report full-time in-person schooling, excluding counties with fewer than 10 reporting in-person schooling. (D) Average number of school-based mitigation measures reported for children with in-person schooling, excluding counties with fewer than 10 reporting in-person schooling.

