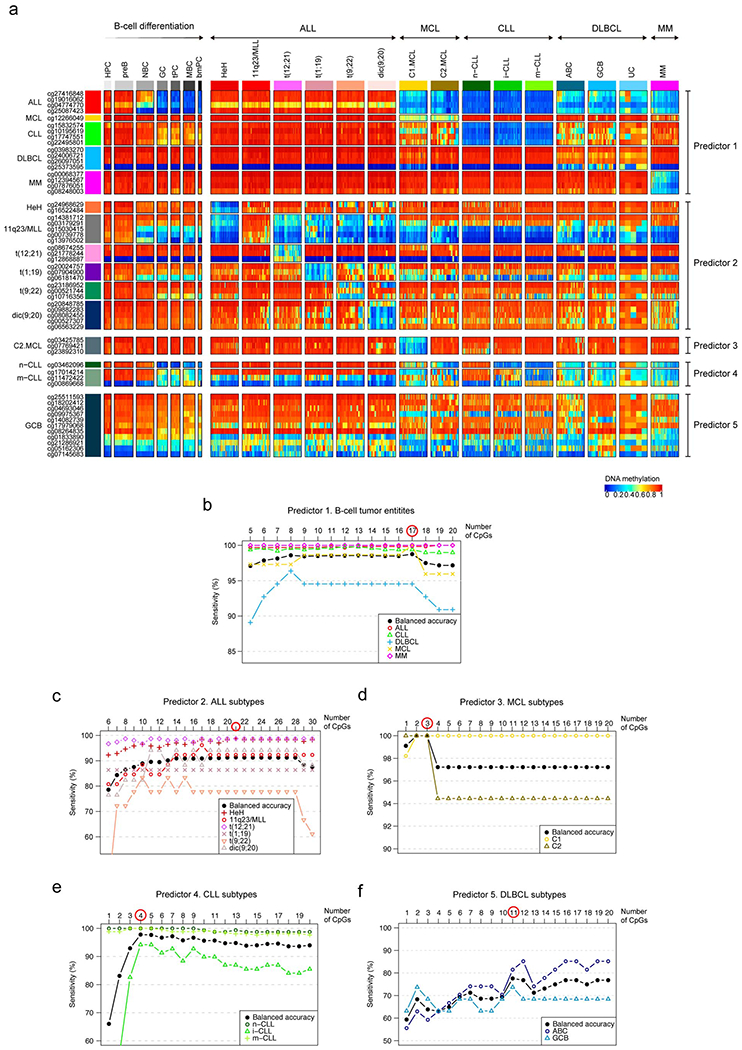
Extended Data Fig. 3. DNA methylation levels and analysis of the sensitivity of the epigenetic classifier of B cell neoplasms.

a, DNA methylation levels of all CpGs from the pan-B-cell diagnostic algorithm in normal and neoplastic B cells. Sample sizes are the training samples shown in Fig. 3b.
b, Estimated sensitivity according to the number of CpGs used in the pan-B-cell diagnostic algorithm for the classification of an unknown B-cell tumor into ALL, MCL, CLL, DLBCL or MM (first step of Fig. 3a, predictor 1). The number of CpGs selected for the predictor was chosen by maximizing the highest balanced accuracy and is indicated with a red circle. This strategy was applied also in the remaining 4 predictors to classify B-cell tumor subtypes in panels c, d, e, and f, (second step of Fig. 3a). Each B-cell tumor is represented with different shapes and colors.
c, Estimated sensitivity according to the number of CpGs used in the pan-B-cell diagnostic algorithm (predictor 2 of Fig. 3a) for the classification of ALL into the subtypes HeH, 11q23/MLL, t(12;21), t(1;19), t(9;22) and dic(9;20) while incrementing the number of CpGs (predictor 2 in Fig. 3a).
d, Estimated sensitivity according to the number of CpGs used in the pan-B-cell diagnostic algorithm (predictor 3 of Fig. 3a) for the classification of MCL into the subtypes C1 or C2 while incrementing the number of CpGs (predictor 3 in Fig. 3a).
e, Estimated sensitivity according to the number of CpGs used in the pan-B-cell diagnostic algorithm for the classification of CLL into the subtypes n-CLL, i-CLL or m-CLL while incrementing the number of CpGs (predictor 4 in Fig. 3a).
f, Estimated sensitivity according to the number of CpGs used in the pan-B-cell diagnostic algorithm for the classification of DLBCL into the subtypes ABC and GCB while incrementing the number of CpGs (predictor 5 in Fig. 3a).
