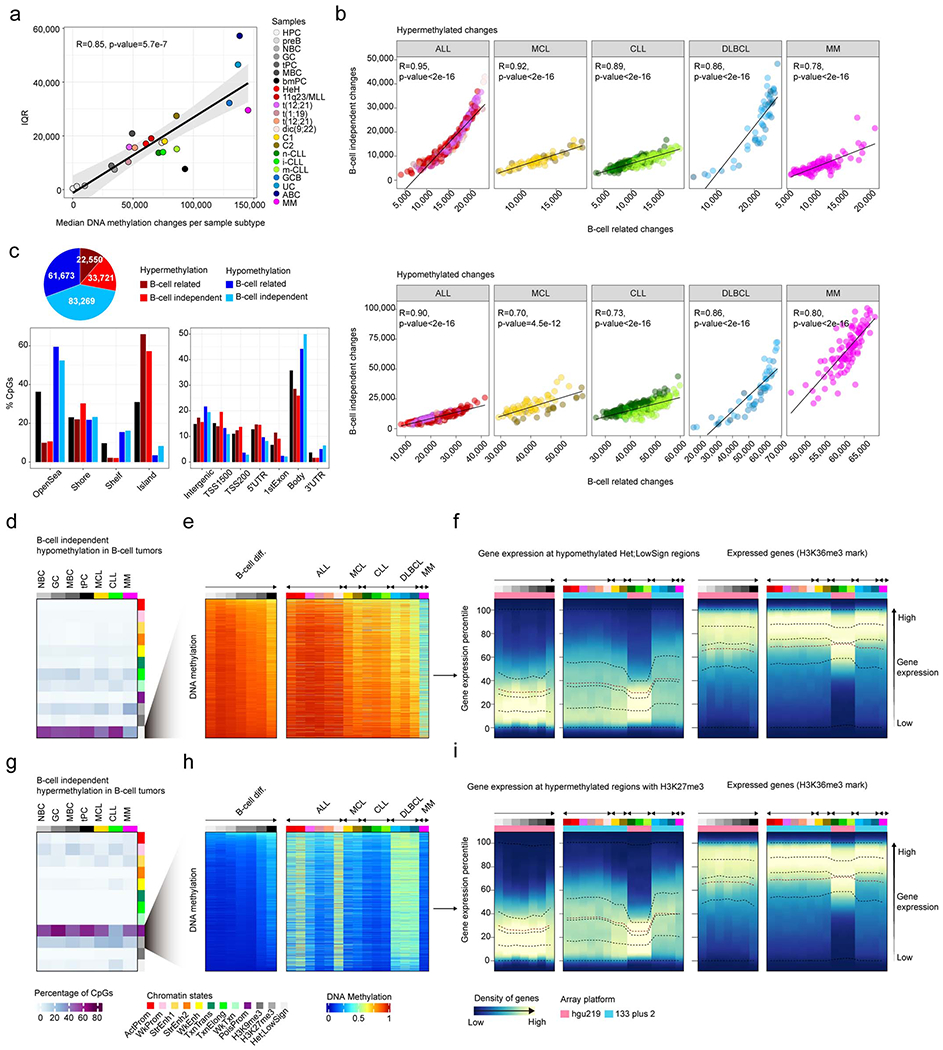
Extended Data Fig. 4. Further characterization of patient-specific DNA methylation changes.

a, Variability of DNA methylation changes measured by the interquartile range (IQR) in normal and neoplastic B cells against the median number of DNA methylation changes per each subtype. R and p-values were derived from linear modelling. Shaded area represents 95% confidence interval.
b, Correlations in all B cell tumors between B-cell independent DNA methylation changes and B-cell related changes for hypermethylation (top) and hypomethylation (bottom) changes. R and p-values were derived from linear models.
c, Number of B-cell related or B-cell independent hyperor hypomethylation in B-cell tumors showing consistent patterns (Methods).
d, B-cell independent CpGs losing DNA methylation in B-cell tumors and the percentages of each chromatin state in normal and neoplastic B-cells. The mean of percentages per sample type is shown. The sample sizes are the same as in Fig. 4c and also apply for panel g.
e , The mean of 2,000 representative CpGs per each sample subtype from panel d is represented.
f, Gene density distributed along the expression percentiles of genes associated with B-cell independent CpGs losing DNA methylation at low signal heterochromatin in B-cell tumors. Expressed genes (H3K36me3) are displayed at right as control. Means within each B-cell subpopulation as well as B-cell tumors are represented.
g, B-cell independent CpGs gaining DNA methylation in B-cell tumors and the percentages in each chromatin state in normal and neoplastic B-cells.
h , The mean of 2,000 representative CpGs per each sample subtype from panel g is represented.
i, Gene density distributed along the expression percentiles of genes associated with B-cell independent CpGs gaining DNA methylation at H3K27me3 regions in B-cell tumors. Expressed genes (H3K36me3) are displayed at right as control. Means within each B-cell subpopulation as well as B-cell tumors are represented. Sample size for DNA methylation analyzes in panels a, b, c, e and h are the same as in Fig. 4a. Samples sizes for gene expression analyses in panels f and i are the same as in Fig. 4e.
