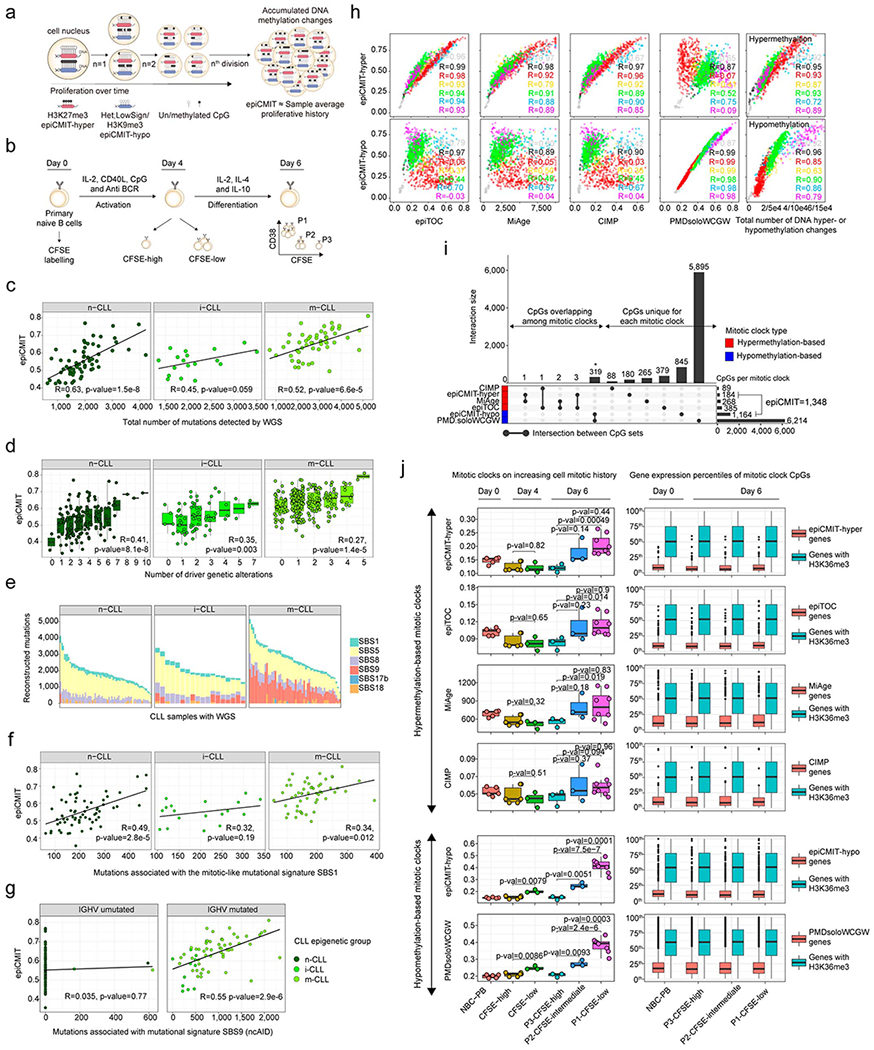
Extended Data Fig. 5. Additional analyses performed to validate the epiCMIT.

a, Illustrative scheme showing DNA methylation changes upon cell division and how they relate to epiCMIT scores.
b, In vitro B-cell differentiation model used to experimentally validate the epiCMIT score. Primary naïve B cells are differentiated into plasma cells in 6 days. At day 0, primary human B cells are incubated with Carboxyfluorescein succinimidyl ester (CFSE) and harvested with activation and proliferation cocktails necessary for plasma cell differentiation. The epiCMIT was calculated at day 0, day 4 and day 6 in B cells with different proliferative histories based on CFSE dilution.
c, The epiCMIT is correlated with total number of mutations detected by WGS in each CLL epigenetic subtype. R and p-values are derived from linear modelling. 138 CLL patient samples with WGS and DNA methylation data are shown (66 n-CLL, 18 i-CLL and 54 m-CLL). The same sample size applies for panel e, f and g.
d, The epiCMIT is correlated with CLL genomic complexity measured by the total number of driver alterations and thus with mutations with positive selection. Fitted linear regression models and derived R and p-values are shown for each group. The sample size for each number of driver alterations are: 0 drivers: n-CLL, n=2, i-CLL, n=5, m-CLL, n=44; 1 driver: n-CLL, n=14, i-CLL, n=19, m-CLL, n=119; 2 drivers: n-CLL, n=37, i-CLL, n=25, m-CLL, n= 55; 3 drivers: n-CLL, n=38, i-CLL, n= 12, m-CLL, n=28; 4 drivers: n-CLL, n=27, i-CLL, n=4, m-CLL, n=12; 5 drivers: n-CLL, n=23, i-CLL, n=2, m-CLL, n=2; 6 drivers: n-CLL, n=10, i-CLL, n=0, m-CLL, n=0; 7 drivers: n-CLL, n=7, i-CLL, n=2, m-CLL, n=0; 8 drivers: n-CLL, n=1; 9 drivers: n-CLL, n=1; 10 drivers: n-CLL, n=1. For the box plots, center line, box limits, whiskers and points represent the median, 25th and 75th percentiles, 1.5× interquartile range and individual samples, respectively.
e, Mutational signatures found in CLL with available WGS. CLL subtypes are shown separately.
f, The epiCMIT is correlated with the mitotic-like mutational signature SBS1. CLL samples are divided in CLL epigenetic subgroups. R and p-values are derived from linear models.
g, The epiCMIT is correlated with the mitotic-like mutational signatures SBS9. CLL samples are separated with the classical IGHV mutational status (98%). R and p-values are shown for each respective linear model.
h, epiCMIT-hyper CpGs and epiCMIT-hypo mitotic clocks are compared with other hyper- or hypomethylation based mitotic clocks as well as the total number of hyper- (rightmost top) or hypomethylation (rightmost bottom) changes per sample since HPC stage. R from linear models are shown. Samples sizes are the same as in Fig. 4a.
i, Overlap among the CpG used to build each mitotic clock. Barplots represent single data values.
j, Performance of all mitotic clocks in the in vitro B-cell differentiation model from panel c. The fraction of epiCMIT which gain methylation (epiCMIT-hyper) and the fraction that lose DNA methylation (epiCMIT-hypo) were analyzed together with hyper- and hypomethylation-based mitotic clocks, respectively. Biological independent sample sizes are the same as in Fig. 5e. P-values are derived from two-sided t-tests and from biological independent experiments. On the right, expression of genes containing any CpG of each respective mitotic clock as well as genes containing CpGs in H3K36me3 regions are depicted (n=14,598). The number of genes analyzed per each mitotic clock are: epiCMIT-hyper, n=155; epiTOC, n=412; MiAge, n=298; CIMP, n=102; epiCMIT-hypo, n1,123; PMDsoloWCGW, n=4053. For the box plot, center line, box limits, whiskers and points represent the median, 25th and 75th percentiles, 1.5x interquartile range and individual samples, respectively.
