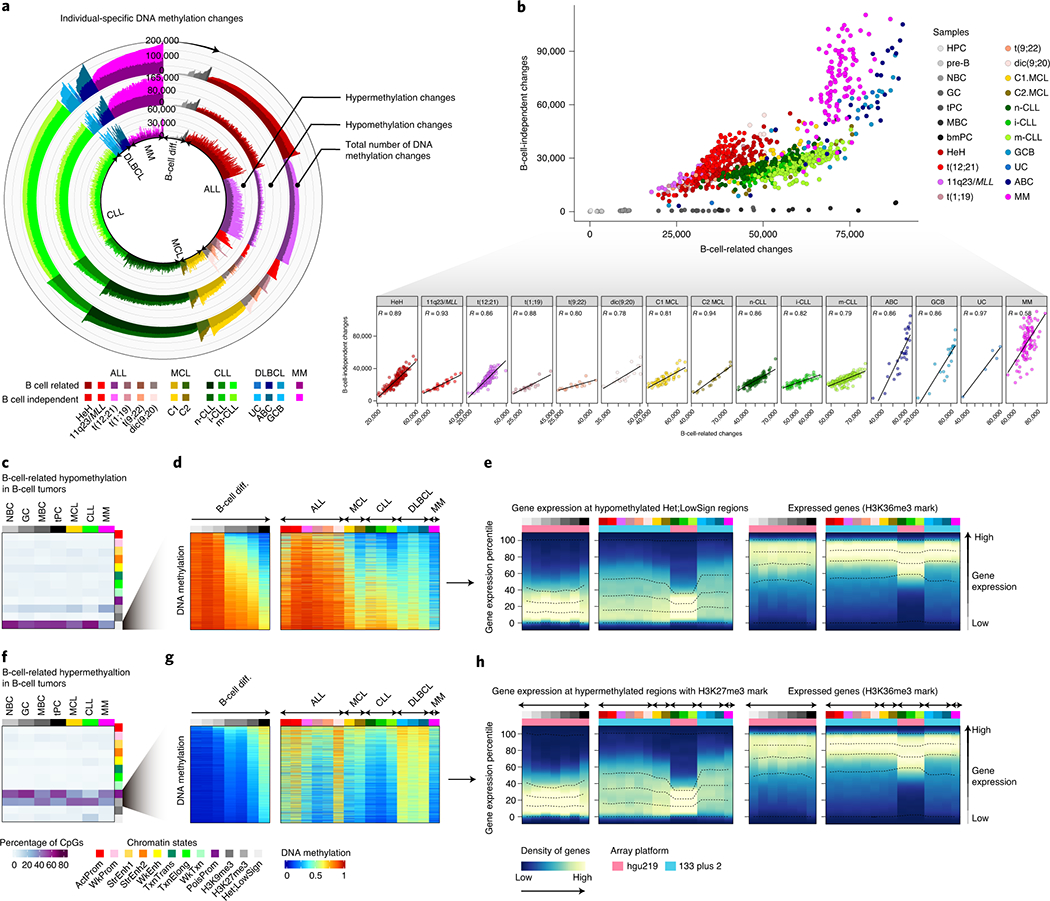
Fig. 4 |. Identification and characterization of patient-specific DNA methylation changes.

a, Number of DNA methylation changes in individual patients for normal and neoplastic B cells as compared to the hematopoietic precursor cell stage. Total number of DNA methylation changes, hypomethylation changes and hypermethylation changes are depicted at outer, middle and inner tracks, respectively. Changes are further classified and color-coded as B-cell related or B-cell independent. Sample sizes are: HPC, n=6; pre-B cells, n= 16; NBC, n=15; GC, n=9; tPC, n=8; MBC, n=10 and bmPC, n=3 donors; HeH ALL, n=168; 11q23/MLL ALL, n=26; t(12;21) ALL, n=152; t(1;19) ALL, n=22; t(9;22) ALL, n=18; dic(9;20) ALL, n=17; C1 MCL, n=56; C2 MCL, n=18; n-CLL, n=161; i-CLL, n=69; m-CLL, n=260; GCB DLBCL, n=19; ABC DLBCL, n= 27; UC DLBCL, n=5 and MM, n=100 patients. The same sample size is applied to panels b, d and g.
b, Correlation between B-cell related changes and B-cell independent changes in normal and neoplastic B-cells. R derived from linear models are shown.
c, B-cell related CpGs losing DNA methylation in B-cell tumors and the percentages in each chromatin state in normal and neoplastic B-cells. The mean of percentages per sample type is shown. Sample sizes are: NBC, n=6; GC, n=3; MBC, n=3 and tPC, n=3 donors; MCL, n=5; CLL, n=7 and MM, n=4 patients. The same sample size applies for panel f.
d, The mean of 2,000 representative CpGs per each sample subtype from panel c is represented.
e, Gene density distributed along the expression percentiles of genes associated with B-cell related CpGs losing DNA methylation in B-cell tumors at low signal heterochromatin. Expressed genes showing the H3K36me3 mark are displayed at right as a positive control. The mean for each sample type is represented. Lines represent 0, 25, 50, 75 and 100% percentiles.
f, B-cell related CpGs gaining DNA methylation in B-cell tumors and the percentages in each chromatin state in normal and neoplastic B-cells. The mean of percentages per sample type is shown.
g, The mean of 2,000 representative CpGs per each sample subtype from panel f is represented.
h, Gene density distributed along the expression percentiles of genes associated with B-cell related CpGs gaining DNA methylation in B-cell tumors in regions containing the H3K27me3 mark. Expressed genes with the H3K36me3 mark are displayed at right as a positive control. Means within each B-cell subpopulation as well as B-cell tumors are represented. Sample subtypes from panels d, e, g and h are color-coded as in panel b. Sample sizes for gene expression analyses in panels e and h are: HPC, n=3; pre-B cells, n=7; NBC, n=10; GC, n=11 tPC, n=5 donors; MBC, n=5 and bmPC, n=1 donors; HeH ALL, n=18; 11q23/MLL ALL, n=5, t(12;21) ALL, n=16, t(1;19) ALL, n=6, t(9;22) ALL, n=5, dic(9;20) ALL, n=6; C1 MCL, n=10; C2 MCL, n=5; n-CLL, n=142, i-CLL, n=64; m-CLL, n=249; GCB DLBCL, n=17, UC DLBCL, n=11, ABC DLBCL, n=15 and MM=328 patients.
