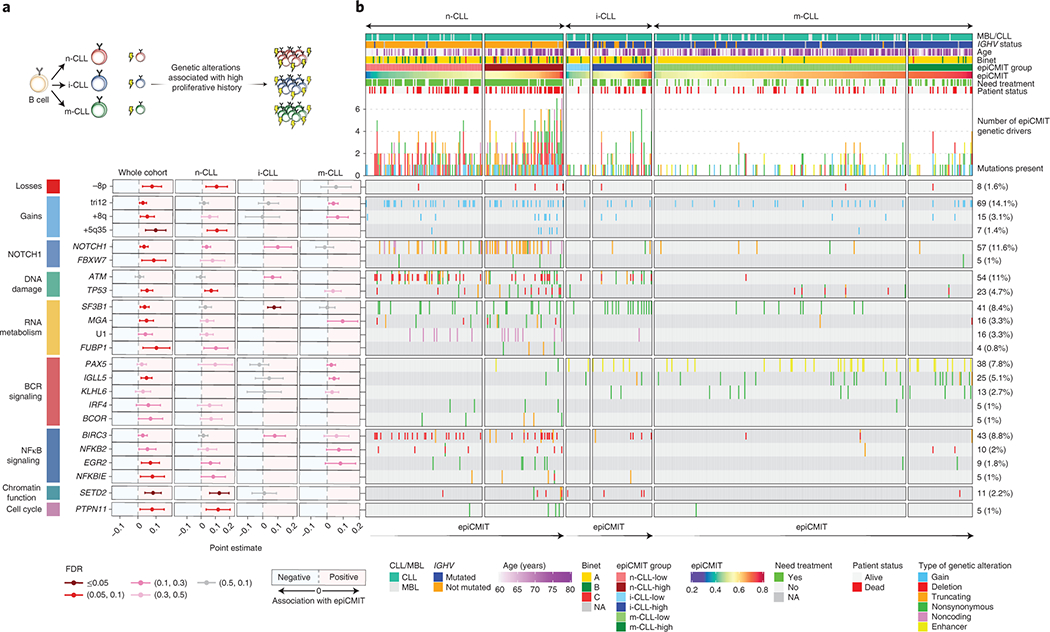
Fig. 7 |. Association between the epiCMIT and genetic driver alterations in CLL.

a, Illustrative scheme to represent which potential genetic driver alterations may confer a higher proliferative capacity to CLL cells.
b, Analysis of the association between the epiCMIT levels and the presence of specific driver genes grouped by signaling pathways. Point estimates with 95% confidence intervals were derived in the whole cohort using linear modelling between epiCMIT and alterations adjusted for CLL subtypes, and with two-sided t-tests within CLL subtypes. Point estimates represent the coefficient of each respective alteration in each corresponding linear model in whole cohort analysis, and the difference between the mean of CLL patients with and without each corresponding alteration for the analysis within each CLL subtypes. Point estimates are color-coded according to FDR correction. The Oncoprint shows genetic driver alterations significantly associated with higher epiCMIT with CLL epigenetic groups shown separately. Other clinicobiological features including MBL or CLL, IGHV status, Age, Binet stage, epiCMIT subgroups based on maxstat rank statistic cutoff, need for treatment and patient status are shown. Cases are ordered within each CLL subgroup from lower to higher epiCMIT values. Genetic driver alterations are depicted with different colors and shapes depending of the alteration type. Number of mutated patients as well as their percentage over the whole cohort is shown on the right. The whole CLL initial series was used for these analyses and is represented (n=490 patients).
