Abstract
Alterations in components of the SWI/SNF chromatin-remodeling complex occur in ~20% of all human cancers. For example, ARID1A is mutated in up to 62% of clear cell ovarian carcinoma (OCCC), a disease currently lacking effective therapies. Here we show that ARID1A mutation creates a dependence on glutamine metabolism. SWI/SNF represses glutaminase (GLS1) and ARID1A inactivation upregulates GLS1. ARID1A inactivation increases glutamine utilization and metabolism through the tricarboxylic acid cycle to support aspartate synthesis. Indeed, glutaminase inhibitor CB-839 suppresses the growth of ARID1A mutant, but not wildtype, OCCCs in both orthotopic and patient-derived xenografts. In addition, glutaminase inhibitor CB-839 synergizes with immune checkpoint blockade anti-PDL1 antibody in a genetic OCCC mouse model driven by conditional Arid1a inactivation. Our data indicate that pharmacological inhibition of glutaminase alone or in combination with immune checkpoint blockade represents an effective therapeutic strategy for cancers involving alterations in the SWI/SNF complex such as ARID1A mutations.
Introduction
The SWI/SNF chromatin remodeling complex remodels nucleosomes to modulate transcription 1. ARID1A functions as a repressor or activator of gene transcription through localizing to promoters or enhancers 2, 3. The SWI/SNF complex is genetically altered in ~20% of human cancers 1, 4. ARID1A is among the most frequently mutated genes across human cancers 1, 4, 5. For example, ARID1A is mutated in up to 62% of ovarian clear cell carcinoma (OCCC) 6-8. Over 90% of ARID1A mutations in OCCC lead to loss of protein expression 6-8. OCCC is generally refractory to the standard-of-care chemotherapy, and when diagnosed at advanced stages, carries the worst prognosis among all histosubtypes of ovarian cancer 9. Therefore, there is an urgent need for effective therapeutic approaches for this devastating disease. There is evidence to suggest that metabolic reprogramming is implicated in OCCC 10. However, clinically applicable therapeutic approaches targeting metabolism in OCCC remain to be explored.
Glutamine, a non-essential amino acid, contributes to biosynthetic pathways in proliferating cells 11. Glutaminase (GLS) is an amidohydrolase that generates glutamate from glutamine 12. GLS is encoded by two genes in humans, GLS1 and GLS2 12. GLS1 is broadly expressed, while GLS2 is primarily expressed in the liver 13, 14. However, the role of ARID1A-containing SWI/SNF complex in regulating glutamine metabolism remains to be fully explored.
While there are reports that the SWI/SNF complex inactivation renders tumors sensitive to immune checkpoint inhibition 15-19, others did not find a consistent association between SWI/SNF genomic alterations and improved clinical outcome to immune checkpoint inhibitors 20. Notably, ARID1A mutation sensitizes ovarian cancer to immune checkpoint blockades such as anti-PD-L1 19, 21. Indeed, there was a trend toward improved response rate toward immune checkpoint blockade in OCCC in clinical trials 22. However, anti-PD-L1 treatment only has a modest effect on improving the survival of mice bearing ARID1A-inactivated tumors 19, 21. This suggests that to achieve a complete eradication of ARID1A-mutated ovarian cancer, combination therapeutic strategies are necessary.
Here we show that ARID1A mutation creates a dependence on glutamine metabolism and clinically applicable glutaminase inhibitor CB-839 alone or in combination with immune checkpoint blockade represents an effective therapeutic strategy for cancers involving alterations in the SWI/SNF complex such as ARID1A mutations.
Results
ARID1A inactivation creates a dependence on glutamine
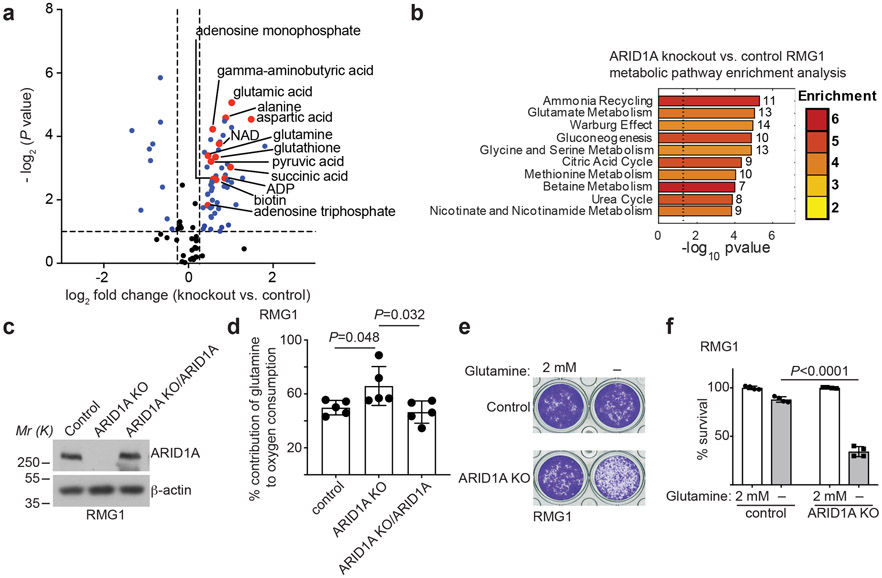
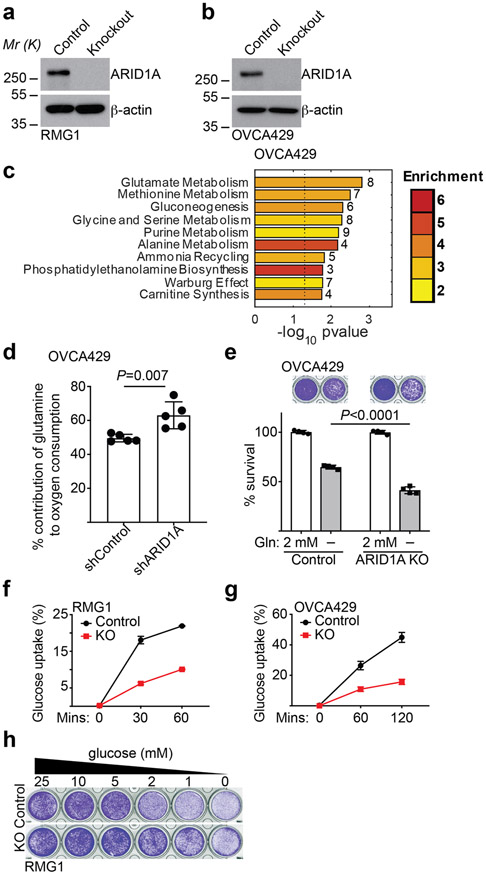
To explore the potential role of ARID1A in regulating metabolic reprogramming, we knocked out ARID1A in ARID1A wildtype RMG1 OCCC cells to mimic loss of ARID1A protein expression caused by >90% of ARID1A mutations (Extended Data Fig. 1a). Notably, ARID1A knockout does not affect cell growth rates 23. We compared steady-state metabolic profiles by liquid chromatography-tandem mass spectrometry (LC-MS/MS) in ARID1A wildtype and ARID1A knockout RMG1 OCCC cells. Compared with ARID1A wildtype controls, the glutamate metabolism/ammonia recycling pathway was significantly enriched by ARID1A knockout in RMG1 cells (Fig. 1a-b and Supplementary Table 1). Consistently, contribution of glutamine to oxygen consumption was significantly increased by ARID1A knockout as determined by Seahorse analysis, which was rescued by restoration of ARID1A expression in these cells (Fig. 1c-d). Indeed, compared with ARID1A wildtype cells, ARID1A knockout cells significantly exacerbated the growth suppression induced by glutamine deprivation (Fig. 1e-f). Similar observations were made in additional isogenic ARID1A wildtype and knockout OCCC cell lines (Extended Data Fig. 1b-e). Notably, glucose uptake was decreased by ARID1A knockout (Extended Data Fig. 1f-g), which correlates with a decrease in sensitivity to glucose deprivation (Extended Data Fig. 1h). These results indicate that ARID1A inactivation creates a dependence on glutamine.
Fig. 1: ARID1A inactivation creates a dependence on glutamine.
a, Volcano plot showing changes for metabolites between control and ARID1A knockout RMG1 cells. Blue indicates changes used for enrichment analysis and red labels metabolites in glutamine metabolism. Plot shows average of 3 independent experiments (included separately as source data). b, Top 10 metabolic pathways enriched by ARID1A knockout in RMG1 cells determined by metabolites set enrichment analysis (MSEA). c, ARID1A expression in parental, ARID1A knockout RMG1 cells with or without wildtype ARID1A restoration determined by immunoblot. Shown are representative of three independent experiments with similar results. d, Contribution of glutamine to oxygen consumption in the indicated cells analyzed by Seahorse. n= 5 independent experiments. e-f, Colony formation (e) and quantification (f) of parental and ARID1A knockout RMG1 cells cultured in medium with or without glutamine deprivation for 12 days. Shown are representative of four independent experiments with similar results in e. n= 4 independent experiments in f. Error bars represent mean with s.d. in d and f. P values were calculated using two-tailed Student t-test in a, d, f and Fisher’s least significant difference test in b.
Inactivation of SWI/SNF complex increases GLS1 expression
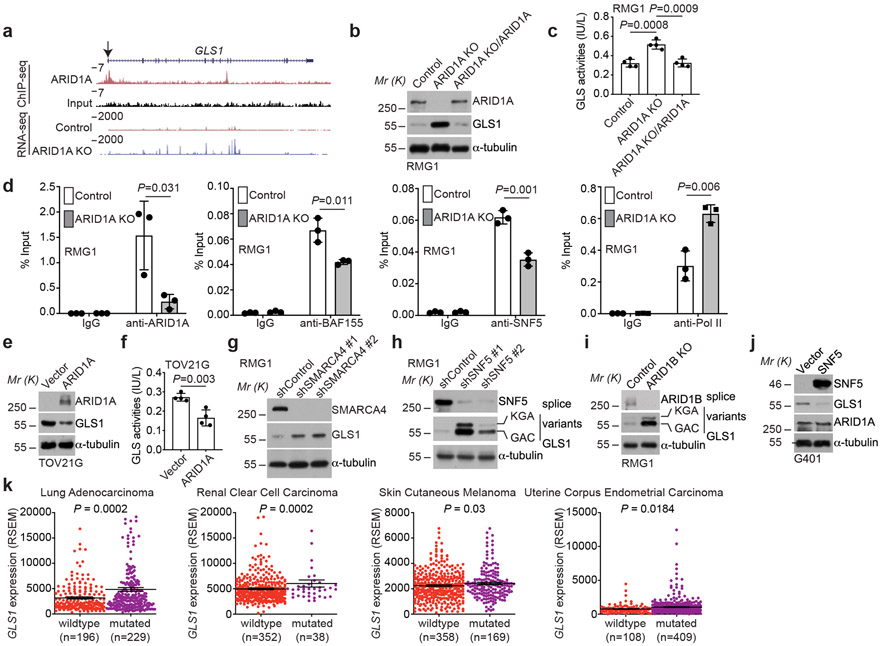
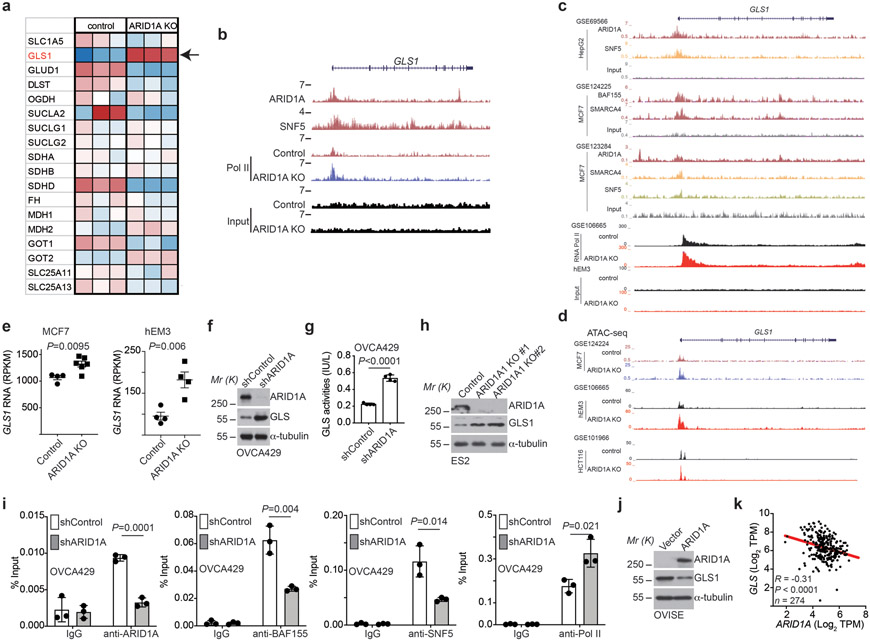
We next sought to determine the mechanism underlying the observed glutamine dependence by ARID1A inactivation. Toward this goal, we cross-referenced ARID1A chromatin immunoprecipitation followed by next generation sequencing (ChIP-seq) analysis in ARID1A wildtype RMG1 cells with differentially expressed genes based on RNA-seq analysis in ARID1A wildtype control and knockout RMG1 cells. The analysis revealed GLS1 as the top direct ARID1A target gene that was significantly upregulated by ARID1A knockout in glutamine metabolic pathway (Fig. 2a and Extended Data Fig. 2a), suggesting that ARID1A functions as a transcriptional repressor of GLS1. Consistently, GLS1 is also a target of SNF5, a core subunit of the SWI/SNF complex and ARID1A knockout increased the association of RNA polymerase II (Pol II)’s association with the GLS1 promoter in RMG1 cells (Extended Data Fig. 2b). Similarly, data mining of the published ChIP-seqs showed that GLS1 is a direct target of SWI/SNF subunits such as ARID1A, SNF5, SMARCA4 and BAF155 (Extended Data Fig. 2c). This correlates with a general increase in accessibility of the GLS1 promoter determined by assay for transposase-accessible chromatin using sequencing (ATAC-seq) (Extended Data Fig. 2d). However, although there is a trend toward an increase in accessibility of the GLS1 promoter in HCT116 cell line, the increase is less robust compared with other cell lines (Extended Data Fig. 2d). Likewise, upregulation of GLS1 by ARID1A knockout was also observed in the published RNA-seq databases (Extended Data Fig. 2e). We validated the upregulation of GLS1 expression and the increase in glutaminase activity in ARID1A knockout RMG1 cells (Fig. 2b-c). Notably, the observed increase in both GLS1 expression and glutaminase activity was rescued by restoration of ARID1A expression, indicating these are ARID1A expression dependent instead of potential off-target effects (Fig. 2b-c). In addition, ARID1A and other core subunits of the SWI/SNF complex such as BAF155 and SNF5 directly bound to the GLS1 promoter as determined by cut-run or ChIP-qPCR analysis (Fig. 2d). Notably, the association of BAF155 and SNF5 with the GLS1 promoter was reduced by ARID1A knockout (Fig. 2d), suggesting that the observed repression of GLS1 by ARID1A is SWI/SNF complex dependent. The enhanced association of RNA Pol II with the GLS1 promoter by ARID1A knockout was also validated (Fig. 2d). Similar findings were made in additional ARID1A wildtype and knockdown or knockout isogenic cell lines (Extended Data Fig. 2f-i). Conversely, restoration of wildtype ARID1A expression in ARID1A-mutated cells suppressed GLS1 expression and reduced glutaminase activity (Fig. 2e-f and Extended Data Fig. 2j). Because mutations in ARID1A and TP53 are typically mutually exclusive 24, 25 and p53 is extensively implicated in metabolic regulation 26, we focused our analysis on cancer cell lines with wildtype TP53. Indeed, GLS1 expression negatively correlates with ARID1A expression in TP53 wildtype cancer cell lines across cancer types according to the Cancer Cell Line Encyclopedia RNAseq database (Extended Data Fig. 2k) 27.
Fig. 2: GLS1 is a direct target of the SWI/SNF complex.
a, ARID1A ChIP-seq and input tracks and RNA-seq tracks in the GLS1 gene locus in parental and ARID1A knockout RMG1 cells. Shown are representative of three independent experiments with similar results. b-c, Parental and ARID1A knockout RMG1 cells with or without wildtype ARID1A restoration were examined for expression of ARID1A and GLS1 by immunoblot (b) or measured for glutaminase activity (c). n= 4 independent experiments. d, The association of ARID1A, BAF155, SNF5 and RNA Pol II with the GLS1 gene promoter in the indicated cells was examined by ChIP-qPCR analysis. An isotype matched IgG was used as a negative control. n= 3 independent experiments. e-f, ARID1A-mutated TOV21G cells with or without wildtype ARID1A restoration were examined for ARID1A and GLS1 expression by immunoblot (e) or measured for glutaminase activity (f). n= 4 independent experiments. g-i, RMG1 cells with SMARCA4 knockdown (g), SNF5 knockdown (h) or ARID1B knockout (i) were examined for GLS1 expression by immunoblot. j, SNF5 mutant G401 cells with or without wildtype SNF5 restoration were examined for SNF5, GLS1 and ARID1A expression by immunoblot. k, GLS1 is expressed at a significantly higher levels in cancers with mutations in subunits of the SWI/SNF complex in the indicated cancer types in the TCGA dataset. Immunoblots are representative of two independent experiments with similar results in b, e, g, h, i and j. Error bars represent mean with s.d. in c, d, f and k. P values were calculated using two-tailed Student t-test in c, d, f and k.
Since repression of GLS1 by ARID1A correlates with changes in the SWI/SNF complex in the GLS1 promoter, we examined whether inactivation of other SWI/SNF components will have similar effects on GLS1 expression. Indeed, knockdown of ARID1B, SMARCA4 (also known as BRG1) or SNF5 subunits of the SWI/SNF complex also upregulated GLS1 expression (Fig. 2g-i). Conversely, restoration of SNF5 expression in SNF5-mutated rhabdoid tumor cells downregulated GLS1 expression (Fig. 2j). Since OCCC was not included in The Cancer Genome Atlas database, we explored the correlation between GLS1 expression and mutations in the SWI/SNF complex in lung adenocarcinoma, renal clear cell carcinoma, skin cutaneous melanoma and uterine corpus endometrial carcinoma in which high frequency of mutations in the SWI/SNF subunits are observed 4. Indeed, GLS1 is expressed at a significantly higher levels in TP53 wildtype tumors with mutations in the SWI/SNF complex (Fig. 2k). Together, we conclude that SWI/SNF complex functions as a repressor of GLS1 expression.
ARID1A inactivation sensitizes cells to GLS inhibition
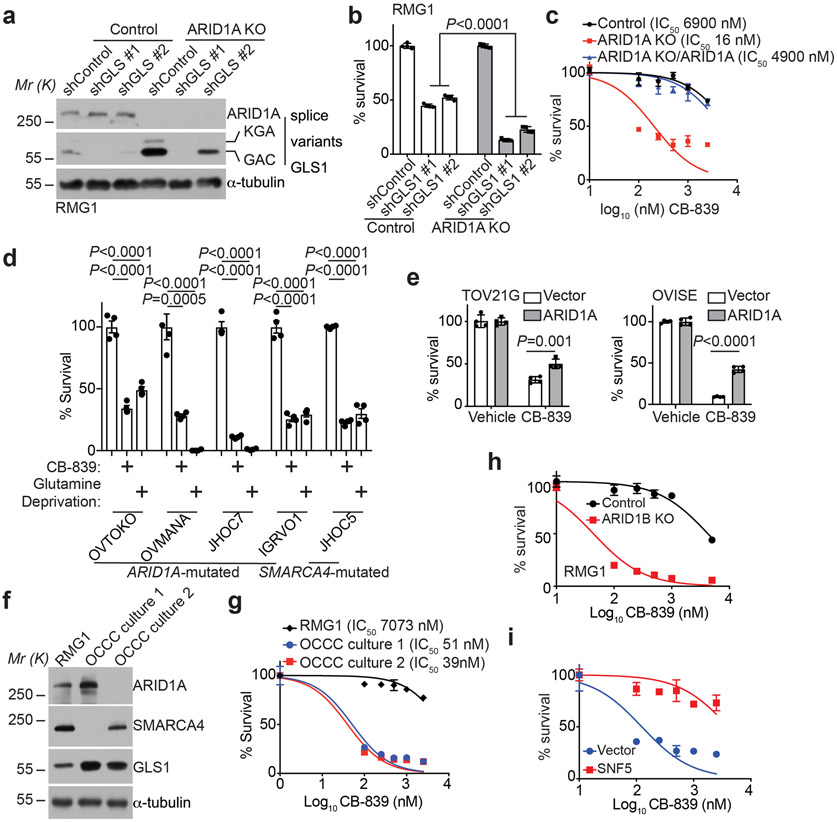
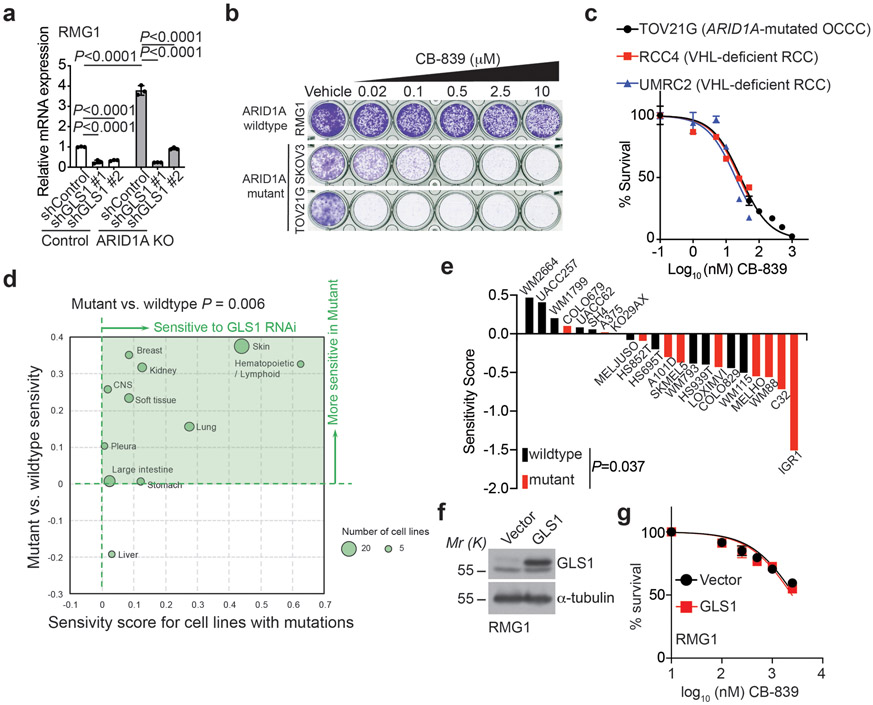
Since ARID1A inactivation creates glutamine dependence and upregulates GLS1 expression, we next sought to determine whether ARID1A inactivation sensitizes cells to GLS1 inhibition. Toward this goal, we inhibited GLS1 activity both genetically by shRNA-mediated knockdown and using a small molecule inhibitor of glutaminase activity. Indeed, genetically knocking down GLS1 expression was significantly more effective in suppressing the growth of ARID1A knockout cells compared to controls (Fig. 3a-b and Extended Data Fig. 3a). We also tested CB-839, a specific glutaminase inhibitor 28, in ARID1A wildtype control and knockout RMG1 cells. We chose CB-839 for our experiments because it is the only GLS inhibitor that is now in clinical trials for other diseases and is proven safe in clinical trials including in combination studies 28, 29. Indeed, compared with ARID1A wildtype control cells, ARID1A knockout significantly decreased the IC50 of CB-839 in RMG1 cells by more than 300-fold (Fig. 3c). The observed effects are ARID1A dependent because the decrease in CB-839 IC50 can be rescued by ectopic expression of wildtype ARID1A (Fig. 3c). In addition, similar growth inhibition was observed in additional ARID1A or SMARCA4-mutated ovarian clear cell cancer cell lines treated with CB-839 or glutamine deprivation (Fig. 3d and Extended Data Fig. 3b). Notably, restoration of ARID1A expression in ARID1A-mutated cells significantly reduced the sensitivity to CB-839 (Fig. 3e). Likewise, CB-839 was effective in suppressing the growth of ARID1A or SMARCA4 inactivated primary OCCC cultures (Fig. 3f-g). Notably, the IC50 of CB-839 was comparable between ARID1A or SMARCA4 inactivated primary OCCC cultures compared with ARID1A knockout cells (Fig. 3c and 3g). In addition, the IC50 of CB-839 was comparable between ARID1A-mutated TOV21G OCCC cells and VHL-deficient renal clear cell carcinoma cell lines that are hypersensitive to CB-839 (Extended Data Fig. 3c) 30. Consistent with the observed upregulation of GLS1 by ARID1A knockout, ARID1B knockout sensitized RMG1 cells to CB-839 (Fig. 3h). Further supporting the notion that the observed effects are SWI/SNF-dependent, restoration of SNF5 expression in SNF5-mutated rhabdoid tumor cells significantly increased the IC50 of CB-839 (Fig. 3i). Indeed, in the Project Achilles synthetic lethality database, GLS1 shRNA was more effective in suppressing the growth of cell lines with mutations in subunits of SWI/SNF complex compared with wildtype cell lines (Extended Data Fig. 3d) 31. For example, for skin cancer cell lines in the database, GLS1 shRNA was significantly more effective against SWI/SNF mutant compared with wildtype cell lines (Extended Data Fig. 3e) 31. Together, we conclude that inactivation of the SWI/SNF complex sensitizes cells to GLS1 inhibition. Notably, ectopic GLS1 expression did not affect sensitivity to CB-839 in ARID1A wildtype RMG1 cells (Extended Data Fig. 3f-g). This is consistent with previous reports that GLS1 upregulation alone is not sufficient to confer sensitivity to CB-839 32, 33.
Fig. 3: Inactivation of the SWI/SNF complex sensitizes cells to glutaminase inhibition.
a-b, Parental and ARID1A knockout RMG1 cells expressing the indicated shGLS1s or control were examined for ARID1A and GLS1 expression by immunoblot (a) or subjected to colony formation and the colonies formed by the indicated cells were quantified (b). n=4 independent experiments. c, Dose response curves of the indicated parental and ARID1A knockout RMG1 cells with or without wildtype ARID1A restoration to glutaminase inhibitor CB-839 determined by colony formation assay. n=4 independent experiments. d, Growth inhibition of the indicated ARID1A or SMARCA4-mutated ovarian clear cell cancer cell lines treated with 0.5 μM CB-839 or glutamine deprivation based on a 12-day colony formation assay. n=4 independent experiments. e, Quantification of growth of TOV21G and OVISE cells with or without wildtype ARID1A restoration treated with or without 0.05 μM or 10 μM CB-839 for 12 days based on colony formation assay. n=4 independent experiments. f, Expression of ARID1A and GLS1 in the indicated ARID1A or SMARCA4-inactivated primary OCCC cultures. g, Dose response curves of the indicated ARID1A or SMARCA4-inactivated primary OCCC cultures to glutaminase inhibitor CB-839 determined by colony formation assay. RMG1 cells were used as a control. n=4 independent experiments. h, Dose response curves of the indicated parental and ARID1B knockout RMG1 cells to glutaminase inhibitor CB-839 determined by colony formation assay. n=4 independent experiments. i, Dose response curves of the indicated parental and wildtype SNF5 restored G401 cells to glutaminase inhibitor CB-839 determined by colony formation assay. n=4 independent experiments. Immunoblots are representative of two independent experiments with similar results in a and f. Error bars represent mean with s.d. in b, c, d, e, g, h and i. P values were calculated using Student two-tailed t-test in b, d and e.
ARID1A inactivation increases glutamine utilization and metabolism through the TCA cycle to support aspartate and nucleotide synthesis.
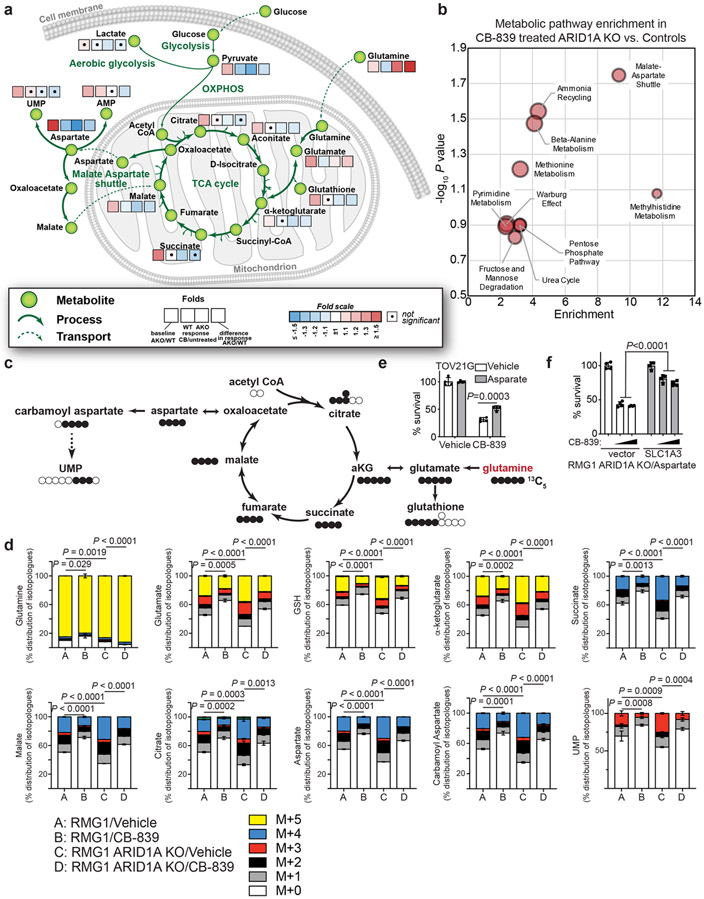
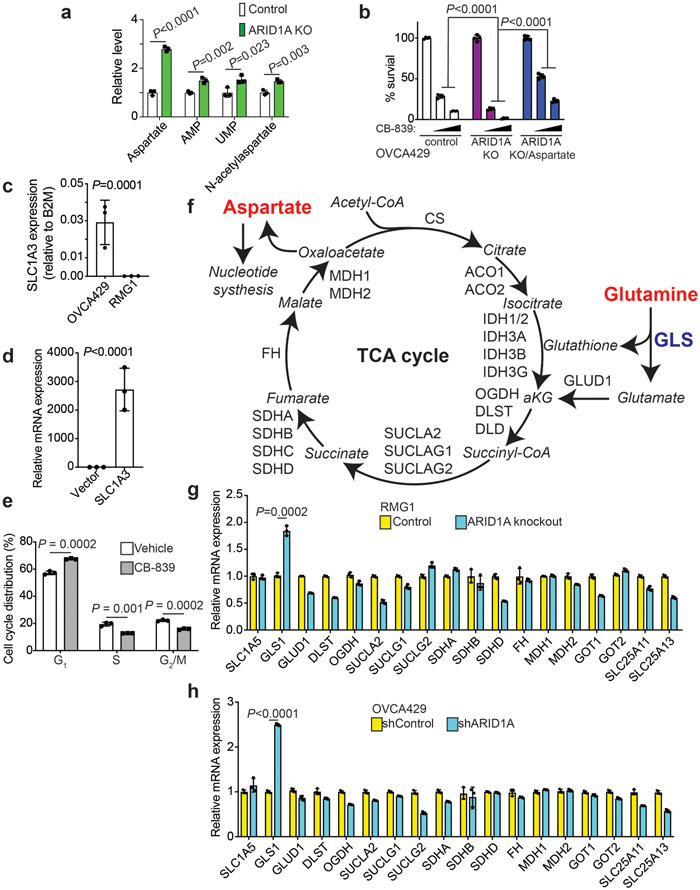
We next sought to determine how the ARID1A status differentially affects glutamine utilization. Toward this goal, we performed liquid chromatography and mass-spectrometry (LC-MS)/MS based analysis of metabolites in ARID1A wildtype control and knockout RMG1 OCCC cells with or without GLS inhibition by CB-839. Metabolic profiling revealed that ARID1A inactivation increases glutamine utilization by the TCA cycle and the use of glutamine to support aspartate and nucleotide biosynthesis (Fig. 4a). Pathway analysis revealed malate-aspartate shuttle as the top pathway enriched based on the differential response to CB-839 between ARID1A knockout cells and controls (Fig. 4b). This further supports that ARID1A inactivation promotes aspartate and nucleotide synthesis from glutamine through the TCA cycle. Cells were next incubated with 13C5-glutamine to infer glutamine metabolism and associated metabolic pathways. The 13C5-glutamine stable isotope tracer analysis revealed that ARID1A knockout increased the metabolism through glutamate, TCA cycle metabolites (such as α-ketoglutarate and citrate), aspartate and nucleotides (such as UMP) (Fig. 4c-d). This suggests that in addition to increasing glutamine uptake by upregulating GLS1, ARID1A inactivation also increased the utilization of key glutamine metabolism metabolites such as aspartate to support the growth of ARID1A inactivated cells. Consistently, aspartate utilization was increased by ARID1A knockout as indicated by the increase in metabolites such as AMP, UMP and N-acetylaspartate (Extended Data Fig. 4a). Consistent with these findings, addition of aspartate in the culture medium of ARID1A-mutated or knockout cells reduced the sensitivity to CB-839 (Fig. 4e and Extended Data Fig. 4b). In addition, ectopic expression of aspartate transporter SLC1A3 in RMG1 knockout cells that do not express endogenous SLC1A3 reduced the sensitivity to CB-839 (Fig. 4f and Extended Data Fig. 4c-d), further supporting that the observed effects are due to changes in aspartate. Finally, supporting the notion that the increase in aspartate generated from glutamine in ARID1A-inactivated cells was utilized for nucleotide synthesis, CB-839 treatment significantly reduced S phase of the cell cycle where nucleotide is utilized for DNA replication (Extended Data Fig. 4e). Consistent with the RNA-seq results and further highlighting the role of ARID1A regulated GLS1 in the observed changes in glutamine metabolism, GLS1 is the top significantly upregulated gene that encodes an enzyme that can positively regulate the metabolism of glutamine into aspartate (Extended Data Fig. 4f-h). Together, we conclude that ARID1A inactivation creates glutamine dependence through both GLS1 upregulation and glutamine utilization such as aspartate generation and nucleotide synthesis.
Fig. 4: ARID1A inactivation increases glutamine-dependent aspartate biosynthesis.
a, Control and ARDI1A knockout RMG1 cells treated with or without glutaminase inhibitor CB-839 were subjected to LC-MS/MS analysis. Heat map indicates fold changes in comparison to parental control without CB-839 treatment. n= 3 independent experiments. b, Analysis of metabolic pathways enriched in CB-839 treated ARID1A knockout RMG1 cells compared with CB-839 treated parental RMG1 cells. c, Schematic of glutamine tracing of aspartate biogenesis. d, The indicated cells were incubated for 16 hours in the presence of 13C5-glutamine and intracellular metabolites were extracted for analysis by LC-MC to evaluate glutamine-dependent metabolism. Mass isotopologues (M+X) analysis of the indicated metabolites are shown as percentage of indicated number of carbons labeled with heavy isotype. n= 3 independent experiments. e, Quantification of colony formation of TOV21G cells treated with or without 0.05 μM CB-839 cultured in the medium supplemented with or without 5 mM aspartate. n= 4 independent experiments. f, Quantification of colony formation by ARID1A knockout RMG1 cells with or without ectopic aspartate transport SLC1A3 expression cultured in medium supplemented with 5 mM aspartate treated with or without the indicated concentration of CB-839. n= 4 independent experiments. Error bars represent mean with s.d. in d, e and f. P values were calculated using two-tailed Student t-test in a, d, e, f and Fisher’s least significant difference test in b.
Clinically applicable glutaminase inhibitor CB-839 is effective against ARID1A-inactivated OCCCs.
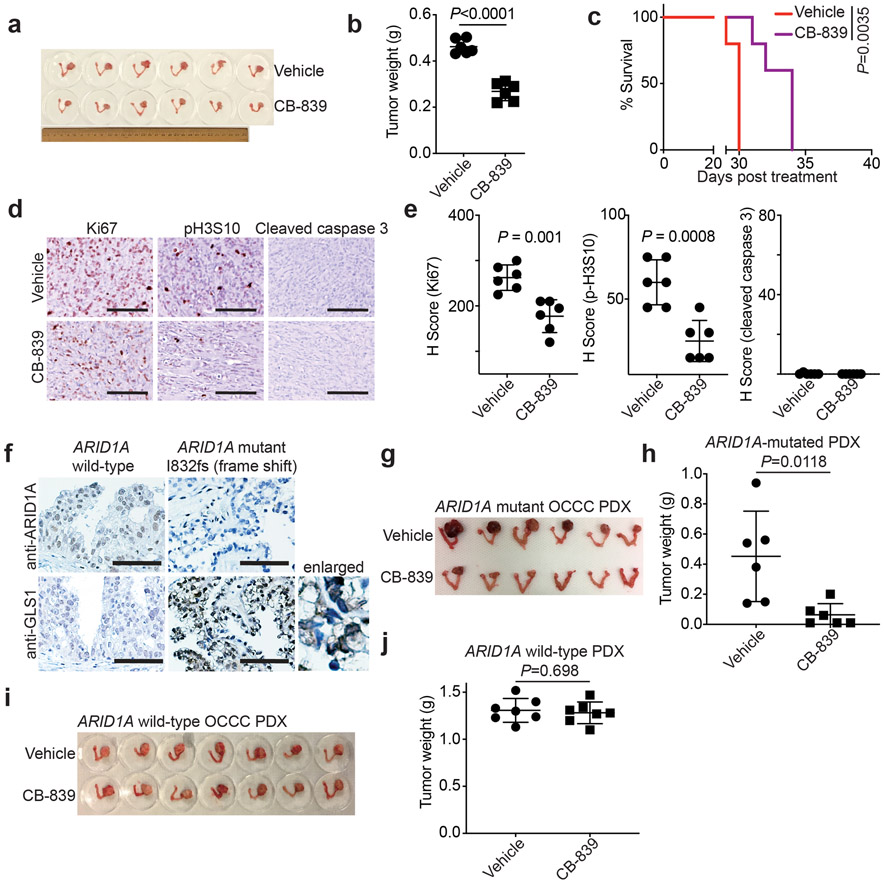
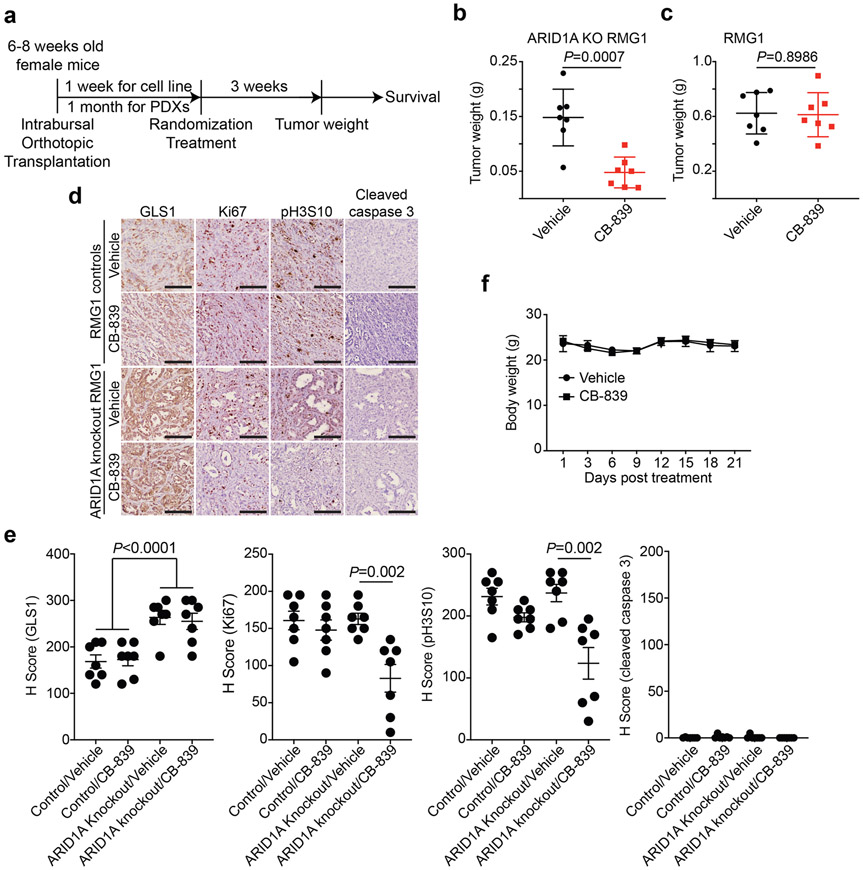
We next sought to determine the therapeutic potential of GLS inhibitor CB-839 for ARID1A-mutated tumors. Toward this goal, we used three different mouse models. First, we used orthotopic xenograft models formed by ARID1A mutated TOV21G OCCC cells. Briefly, the orthotopically transplanted cells were allowed to grow for one week to establish the orthotopic tumors (Extended Data Fig. 5a). Mice were then randomized and treated twice daily for three weeks with vehicle control or CB-839 (200 mg/kg) orally, the same dose as previously reported 34. We used tumor weight as a surrogate for tumor burden. Notably, the CB-839 treatment significantly reduced the burden of orthotopic xenografts formed by ARID1A-mutated cells (Fig. 5a-b). This correlated with a significant improvement of survival of tumor bearing mice (Fig. 5c). Notably, the observed tumor suppressive effect by CB-839 treatment is ARID1A status dependent. For example, the CB-839 treatment significantly reduced the burden of orthotopic xenografts formed by ARID1A knockout RMG1 cells (Extended Data Fig. 5b). In contrast, CB-839 did not significantly affect the growth of tumors formed by ARID1A wildtype control RMG1 cells (Extended Data Fig. 5c). Notably, CB-839 significantly reduced the expression of cell proliferation marker Ki67 and mitotic marker serine 10 phosphorylated histone H3 (p-H3S10) in tumors formed by ARID1A-mutated TOV21G or ARID1A knockout but not control wildtype RMG1 cells (Figure 5d-e and Extended Data Fig. 5d-e). In contrast, expression of apoptosis marker cleaved caspase 3 was not affected by CB-839 treatment (Figure 5d-e and Extended Data Fig. 5d-e). This is consistent with our in vitro finding that CB-839 significantly reduced S phase of the cell cycle in ARID1A inactivated cells. We next sought to expand these studies into OCCC patient-derived xenografts. Consistent with our mechanistic studies, compared with ARID1A wildtype OCCC PDX, GLS1 was upregulated in the OCCC PDX harboring a frameshift ARID1A mutation (Fig. 5f). Indeed, CB-839 significantly reduced the tumor burden in ARID1A-mutated, but not ARID1A wildtype, OCCC PDXs (Fig. 5g-j). Consistently with previous reports 28, CB-839 was well tolerated in vivo. For example, CB-839 treatment did not affect the body weight of the treated tumor-bearing mice (Extended Data Fig. 5f). Thus, we conclude that glutaminase inhibitor CB-839 is effective in ARID1A-inactivated OCCCs.
Fig. 5: Glutaminase inhibition suppresses the growth of ARID1A-inactivated OCCCs in vivo.
a-e, Orthotopic xenografts formed by ARID1A-mutated TOV21G cells were treated with vehicle or CB-839. Shown are images of reproductive tracks with tumors from the indicated groups at the end of treatment (a). Tumor weight was measured as surrogate for tumor burden (n=6 mice/group) (b). After stopping the treatment, the mice from the indicated treatment groups were followed for survival by Kaplan-Meier method (n=5 mice/group) (c). Dissected tumors from the indicated treatment groups were subjected to immunohistochemical staining for cell proliferation marker Ki67, mitotic marker p-H3S10 or apoptosis marker cleaved caspase 3 on serial sections (d) and the histological score (H-score) of the indicated markers was quantified from three separate fields from six tumors from six individual mice in each of the indicated treatment groups (e). Scale bar = 100 μm. f, Expression of ARID1A and GLS1 in the indicated ARID1A wildtype or mutated OCCC PDXs determined by immunohistochemical staining. Shown are representative images of three independent technical replicates from the same pair of ARID1A wildtype and mutant PDXs. Bars = 100 μm. g-h, Mice bearing ARID1A-mutated OCCC PDXs were treated with vehicle or CB-839 (n=6 mice/group). Shown are images of reproductive tracks with tumors from the indicated groups at the end of treatment (g). Tumor weight was measured as surrogate for tumor burden (h). i-j, Same as g-h, but for ARID1A wildtype OCCC PDXs (n=7 mice/group). Error bars represent mean with s.d. in b, e, h and j. P values were calculated using two-tailed Student t-test in b, e, h, j and log-rank test in c.
Glutaminase inhibitor synergizes with immune checkpoint blockade in an ARID1A-inactivated immunocompetent OCCC model.
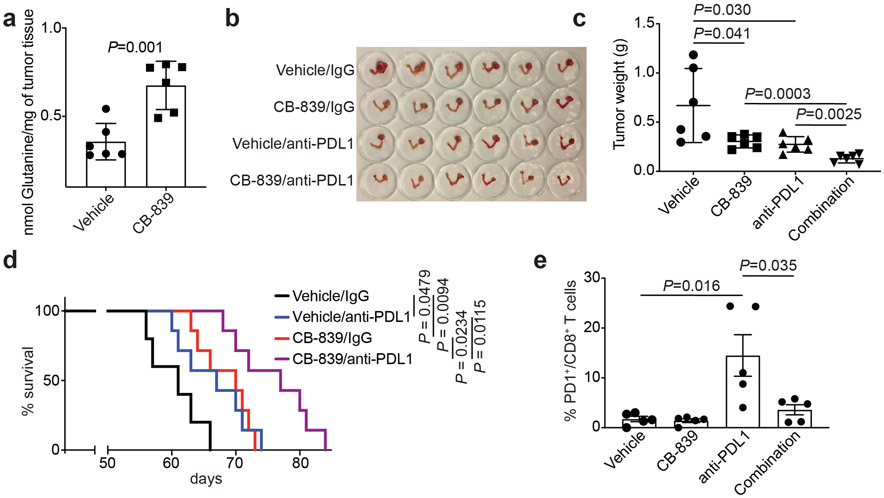
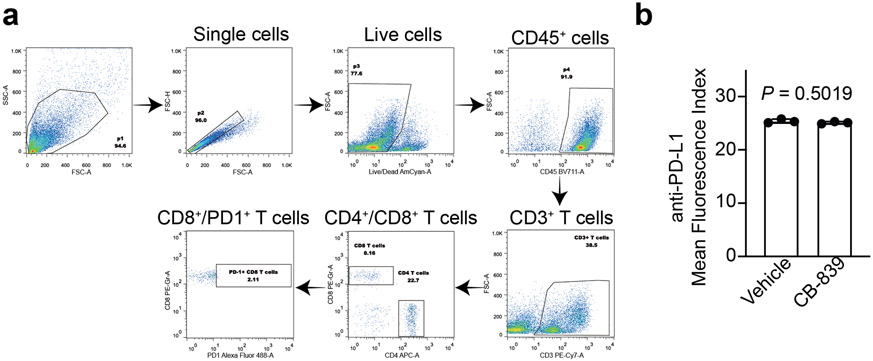
Lymphocyte function in the tumor microenvironment is regulated by glutamine metabolism 35. Notably, in a conditional genetic Arid1aflox/flox /Pik3caH1047R OCCC mouse model as we and others published 25, 36, CB-839 treatment significantly increased glutamine levels in the treated tumors (Fig. 6a). Consistent with our findings from orthotopic xenograft and PDX models, CB-839 treatment significantly reduced the burden in the pre-established genetic OCCC model (Fig. 6b-c). ARID1A mutation confers sensitivity to immune checkpoint blockades such as anti-PDL1 19, 21. In addition, recent evidence shows that glutamine antagonism in effector T cells can be exploited as a “metabolic checkpoint” 37. Thus, we examined whether CB-839 synergizes with anti-PDL1 in the Arid1a/Pik3ca immune competent OCCC genetic mouse model. Indeed, a combination of CB-839 and anti-PDL1 was significantly more effective in reducing the tumor burden and improving survival of tumor-bearing mice compared with either one of the individual treatments (Fig. 6d). Consistent with previous reports 37, 38, CB-839 treatment prevented CD8 T cell exhaustion induced by anti-PDL1 antibody as evidenced by a decrease in PD1 positive CD8 T cells (Fig. 6e and Extended Data Fig. 6a). Notably, CB-839 did not affect PDL1 expression on ARID1A-mutated TOV21G cells (Extended Data Fig. 6b). Together, we conclude that clinically applicable GLS inhibitor CB-839 synergizes with immune checkpoint blockade in suppressing the growth of ARID1A-inactivated OCCC.
Fig. 6: Glutaminase inhibition in combination with immune checkpoint blockade suppresses the growth of Arid1a/Pik3ca OCCC.
a, Glutamine levels in the OCCCs developed from the Arid1a/Pik3ca genetic mouse model treated with vehicle control or CB-839 (n=6 mice/group). b-c, Mice bearing Arid1a/Pik3ca OCCCs were randomized into four indicated treatment groups. Shown are images of reproductive tracts with tumors from the indicated groups at the end of treatment (b). Tumor weight was measured as surrogate for tumor burden (c) (n=6 mice/group). d, After completing treatment, the mice were followed for survival, and the Kaplan-Meier survival curves for each of the indicated groups are shown (n=7 mice/group). e, At end of treatment, percentage of PD1 positive CD8 T cells was assessed by flow cytometry in the peritoneal wash in which tumors have disseminated. Error bars represent mean with s.d. in a and c, and with s.e.m. in e. P values were calculated using two-tailed Student t-test in a, c, e and log-rank test in d.
Discussion
Here we show that inactivation of the SWI/SNF complex subunits such as ARID1A creates a dependence on glutamine, which correlates with transcriptional repression of the GLS1 gene by the SWI/SNF complex. The observed glutamine dependence correlates an increase in the utilization of glutamine carbon through the TCA cycle to generate aspartate that is an essential substrate for nucleotide synthesis 39, 40. Consistent with previous reports 33, the observed glutamine dependence was created by both an upregulation of GLS1 and an increase in glutamine utilization, which supports our findings that GLS1 activity is necessary but not sufficient to confer sensitivity to glutaminase inhibitor CB-839. These findings suggest that ARID1A may also regulate other metabolic pathways that utilize intermediate glutamine metabolites, which together with GLS1 upregulation confers sensitivity to glutaminase inhibitor. Consistent with our findings, a previous study showed mutation in the SWI/SNF subunit SMARCA4 in lung cancer enhances oxidative phosphorylation 41. Interestingly, we show that ARID1A inactivation creates glutamine dependence with a simultaneous decrease in glucose uptake. These findings suggest that inactivation of the SWI/SNF complex reprograms metabolic pathway from glycolysis to glutamine dependence.
Our results show that clinically applicable glutaminase inhibitor CB-839 can be repurposed for SWI/SNF altered cancers such as ARID1A-mutated OCCCs that currently lack effective therapeutic options. This is a personalized therapeutic strategy because ARID1A mutation serves as a biomarker, while ARID1A repressed GLS1 serves as ARID1A mutation-dependent therapeutic target. A limitation of this approach is that GLS1 regulation by ARID1A is SWI/SNF complex dependent. For example, deletion of chr19p where SMARCA4 is located has been reported in OCCCs 7 and our results showed that SMARCA4 inactivation also upregulates GLS1 and confers sensitivity to CB-839 in both cell lines and primary cultures. In addition, our findings support that a combination of glutaminase inhibition with immune checkpoint blockade is synergistic in suppressing ARID1A-inactivated tumors. The combination is unique in that it leverages both the tumor suppressive effects of glutaminase inhibition in tumor cells and boosting the antitumor immunity in the tumor microenvironment 37. Notably, glutaminase inhibitor CB-839 is well tolerated in clinical trials as a single agent and in combination studies 28, 29. In addition, immune checkpoint blockades are FDA-approved. Thus, the combinatory therapeutic strategy reported here is immediately translatable to potentially benefit patients. Given the fact that ARID1A is the most frequently mutated epigenetic regulator and SWI/SNF is altered in ~20% of all human cancers 1, 4, 5, we expect our findings to have far-reaching implications in developing urgently needed therapeutic approaches for these tumors.
Methods
Cell lines
Ovarian clear cell carcinoma cell line RMG1 cells were cultured in 1:1 Dulbecco’s modified Eagle’s medium (DMEM)/F12 supplemented with 10% FBS. Ovarian clear cell carcinoma cell line TOV21G, OVCA429, OVISE, SKOV3 and ES2 cells were cultured in RPMI 1640 with 10% fetal bovine serum (FBS) and 1% penicillin/streptomycin at 37°C supplied with 5% CO2. Ovarian clear cell carcinoma cell line JHOC5 and JHOC7 and JHOC9 were purchased from Riken cell bank, OVTOKO and OVMANA cell lines were obtained from JCRB cell bank, and IGROV1 cells were obtained from NCI cell bank. These cells were cultured in RPMI supplemented with 10% FBS and maintained at 37 °C supplied with 5% CO2. Rhabdoid tumor cell lines G401 cells were cultured in McCoy’s 5a medium with 10% fetal bovine serum (FBS) and 1% penicillin/streptomycin at 37°C supplied with 5% CO2. Renal clear cell cancer lines UMRC2 and RCC4 were cultured in DMEM supplemented with 10% FBS and maintained at 37 °C supplied with 5% CO2. Viral packing cells 293FT and Phoenix were cultured in DMEM with 10% fetal bovine serum (FBS) and 1% penicillin/streptomycin at 37°C supplied with 5% CO2. Primary human ovarian clear cell cultures were as described previously 25. The protocol for using primary cultures of human ovarian clear cell tumor cells was approved by the University of British Columbia Institutional Review Board (H18-01652). Informed consent was obtained from human subjects. All relevant ethical regulations have been complied with. The primary tumor cells were cultured in RPMI 1640 supplemented with 10% fetal bovine serum (FBS) and 1% penicillin/streptomycin. All the cell lines are authenticated using short tandem repeat DNA profiling. Mycoplasma testing was performed using LookOut Mycoplasma PCR detection (Sigma) every month. ARID1A knockout RMG1 and OVCA429 cells were generated previously 23.
Plasmids and lentivirus/retrovirus infection
plentiCRISPR v2 (#52961) and pMXS-SLC1A3 (#72873) were obtained from Addgene. pLKO.1-shARID1A (TRCN0000059090) was purchased from Open Biosystems (#RHS3979-201776877). pLKO.1-GLS1-shRNA1 (TRCN0000051134), pLKO.1-GLS1-shRNA1 (TRCN0000051135), pLKO.1-SMARCB1-shRNA1 (TRCN0000039585), pLKO.1-SMARCB1-shRNA2 (TRCN0000039587), pLKO.1-SMARCA4-shRNA1 (TRCN0000015549) and pLKO.1-SMARCA4-shRNA2 (TRCN0000015552) were obtained from the Wistar Institute Molecular Screening and Protein Expression Facility. FUGW V5-GLS1 was obtained from Dr. Chi Van Dang as previously published 32. HEK293FT/Phoenix cells were transfected by Lipofectamine 2000 for lentivirus package. Lentivirus was harvested and filtered with 0.45 μm filter 48 hrs post transfection. Cells infected with lentivirus/retrovirus were selected in 1 μg/ml puromycin or 1 μg/ml blasticidin 48 hrs post infection.
Colony formation
Cells were seeded in 24-well plates with different number according to the growth rate. RPMI medium with 10% fetal bovine serum (FBS) and 1% penicillin/streptomycin was used for all the colony formation experiments. The medium was changed every 2 days with appropriate drug doses for 10-12 days. Colonies were stained with 0.05% crystal violet. The signal was quantified by intensity using NIH ImageJ software.
Western blot
Whole cell lysate was extracted with RIPA lysis buffer (50mM Tris pH 8.0, 150mM NaCl, 1% Triton X-100, 0.5% sodium deoxycholate, 1 mM EDTA, 1 mM DTT and 1mM PMSF) on ice. Proteins were denatured using 1X SDS loading buffer (50 mM Tris-HCl (pH6.8), 2%SDS, 10% Glycerol, 0.1% Bromophenol blue and 10 mM DTT) and separated by SDS-PAGE and transferred to PVDF membrane (Millipore). Membranes were blocked with 5% non-fat milk and then incubated with primary antibodies and secondary antibodies.
Antibodies to the following proteins were used in the western blots: rabbit anti-ARID1A (Cell Signaling, cat. no. 12354, 1:1000 for western blot), rabbit anti-SMARCA4 (Cell Signaling, cat. no. 49360, 1:1000 for western blot), rabbit anti-ARID1B (Abgent, cat. no. AT1190a, 1:1000 for western blot), rabbit anti-GLS (Abcam, cat. no. 93434, 1:2000 for western blot), rabbit anti-SNF5 (Bethyl, cat. no. A301-087A, 1:1000 for western blot), rabbit anti-α-tubulin (Cell Signaling, cat. no. 2125, 1:2000 for western blot), mouse anti-β-actin (Sigma, cat. no. A5316, 1:5000 for western blot).
Metabolite profiling and isotope tracing
LC-MS/MS was performed by the Wistar Proteomics and Metabolomics Facility. For metabolite profiling experiments, cells (2 million per sample) were treated with 1 μM CB-839 for 3 days. Polar metabolites were extracted with 1 ml ice-cold extraction solution (80% LC/MS grade methanol/0.2 μM internal standard mix (Cambridge isotope, MSK-A2-1.2) in water). After 15 sec vortex and 15 min incubation on dry ice, samples were spun down for 15 min at 4°C at maximum speed. The supernatant was transferred to a new tube and stored at −80°C. The pellet was used to determine the protein concentration. For glutamine tracing experiment, cells were pre-treated with 1 μM CB-839 for two days and labeled with fresh 1 mM 13C5-L-glutamine for 16 hrs. Cells were spun down and pellets were resuspended in ice-cold extraction solution containing LC-MS grade methanol, acetonitrile and ultrapure water at a ratio 5:3:2 (v/v/v). Samples were vortexed for 5 min at 4°C prior to centrifugation. The final cleared metabolite extracts from the cells were transferred to silanized glass vials and loaded onto an autosampler for analysis by LC-MS. LC-MS analysis was performed on a Q Exactive HF-X Hybrid Quadrupole-Orbitrap mass spectrometer (Thermo Fisher) equipped with a HESI II probe and coupled to a Vanquish Horizon UHPLC system (Thermo Fisher). 2 μL of sample was injected and separated by HILIC chromatography on a ZIC-pHILIC 2.1-mm i.d ×150 mm column (EMD Millipore). The mobile phase A was 20 mM ammonium carbonate, 0.1% ammonium hydroxide, pH 9.2, and mobile phase B was acetonitrile. The LC was run at a flow rate of 0.2 ml/min and the gradient used was as follows: 0 min, 85% B; 2 min, 85% B; 17 min, 20% B; 17.1 min, 85% B; and 26 min, 85% B. The column was maintained at 45°C and the mobile phase was also pre-heated at 45°C before flowing into the column. The relevant MS parameters were as listed: sheath gas, 40; auxiliary gas, 10; sweep gas, 1; auxiliary gas heater temperature, 350°C; spray voltage, 3.5 kV for the positive mode and 3.2 kV for the negative mode. Capillary temperature was set at 325°C, and funnel RF level at 40. Samples were analyzed in full MS scan with polarity switching at scan range 65 to 975 m/z; 120,000 resolution; automated gain control (AGC) target of 1E6; and maximum injection time (max IT) of 100 ms. Identification and quantitation of metabolites was performed using TraceFinder 4.1 and Compound Discoverer 3.0 (Thermo Fisher).
Metabolite set enrichment analysis
The metabolite level was determined from the MS peak area and normalized to the protein concentration. The Student’s t-test was used to identify the difference between two groups. The differential metabolites (P value<0.1, fold change>1.3) were used for pathway enrichment analysis. Metabolomic pathways were identified using Metabolite Set Enrichment Analysis (MSEA version 4.0) (available at https://www.metaboanalyst.ca/faces/upload/PathUploadView.xhtml). Over Representation Analysis (ORA) was utilized for comprehensive screening of affected pathways.
Glucose uptake assay
For glucose uptake assay, cells were seeded in 6-well plates to grow at 70% confluence. The regular medium was removed (10% FBS) and cells were incubated in 0.5% FBS medium with 10 μM 2-NBDG (Thermo Fisher) at 37°C with 5% CO2 for the indicated time period. After incubation, cells were collected and washed twice with ice-cold PBS on ice. Samples were analyzed on LSRII flow cytometer (488 nm excitation laser). Mean fluorescence intensity was quantified by FlowJo v10.0.7 software.
Seahorse mitochondrial fuel dependency
Glutamine dependency was determined according the instruction of Agilent Seahorse XF Mito Fuel Flex Test kit (Agilent). Briefly, cells (RMG1 cells, 20000/well; OVCA429 cells, 10000/well) were seeded in XF96 Cell Culture Microplate the day before running the assay. The next day, the cells were incubated with 180 μl DMEM without FBS at 37°C in a non-CO2 incubator for 1 h. Working concentrations of the inhibitors used in glutamine dependency assay are as followed: CB-839 at 5 μM, UK 5099 at 20 μM, Etomixir at 10 μM and Rotenone/Oligomycin A at 2 μM. The assay was run on Seahorse Bioanalyzer XFe96. The glutamine dependency was calculated by the equation in the manual provided by the manufacturer. Samples were normalized by protein concentration.
Glutaminase activity and glutamine measurement assay
Glutaminase activity was determined using Glutaminase (GLS) Assay Kit (Biomedical Research Service). Briefly, two million cells were washed with ice-cold PBS and lysated by 100 μL 1X Cell Lysis buffer on ice for 5 min with gentle agitation. The Supernatant was collected after centrifugation at maximum for 3 min. Followed by measuring the protein concentration, samples were diluted to 0.2-2 mg/ml and 10 μL was used for GLS assay. Samples were combined with 40 μL fresh glutamine solution and incubated at humidified 37°C non-CO2 incubator for at least 2 h. Followed by adding 50 μL TA Assay solution and incubating for another 2 h, the reaction was stopped by adding 50 μL 3% acetic acid. GLS activity was measured by absorbance at OD492 using a plate reader (Versamax).
Tumor glutamine levels were determined using Glutamine Assay Kit (Colorimetric)(Abcam) following the instructions. Briefly, 10-20 mg tumor tissue was washed with cold PBS and resuspended in 10X of ice-cold hydrolysis buffer. Tissue was homogenized and centrifuged for 10 min at 4°C at 10000g. Supernatant was deproteinized by 10kD Spin column. The deproteinized samples will be used for glutamine detection. The absorbance at 450 nm was measured on a microplate reader.
Reverse-transcriptase quantitative PCR (RT-qPCR)
Total RNA was extracted using Trizol (Invitrogen) according to the manufacturer's protocol. Extracted RNAs were used for RT-PCR with High-Capacity cDNA Reverse Transcription Kit (Thermo Fisher). Quantitative PCR was performed using QuantStudio 3 Real-Time PCR System. The primers were shown in Supplementary Table 2.
Chromatin immunoprecipitation (ChIP) and CUT&RUN
ChIP was performed as we previously described 42. The following antibodies were used for ChIP: rabbit anti-SNF5 (Bethyl, cat. no. A301-087A, 5 μg/IP), rabbit anti-BAF155 (Abcam, cat. no. ab172638, 2 μg/IP) and mouse anti-Pol II (Santa Cruz, cat. no. sc-47701, 5 μg/IP). Isotype-matched IgGs were used as negative controls. ChIP DNA was purified by Zymo ChIP DNA clean and concentrator kit (Zymo research) and analysed by qPCR. The primers targeting GLS promoter used for ChIP-qPCR were shown in Supplementary Table 2.
CUT&RUN was performed as described 43 with modifications. In brief, five million cells were permeabilized with 0.02% digitonin. Pellets were washed and incubating with antibody buffer containing ARID1A antibody (Abcam, cat.no. ab182560, 1:100 dilution) at 4°C for at least 15 min with rotation. Followed by wash, the pellets were incubated with 700 ng/ml pA-MNase (provided by the Henikoff laboratory) at 4°C for 1 h. Targeting digestion was initiated by adding 100 mM CaCl2 to a final concentration of 2 mM. The digestion was stopped by mixing in 2XSTOP solution. Solubilized chromatin fragments were released and purified for qPCR.
Cell cycle analysis
For cell cycle analysis, cells were harvested at 40% confluence upon treatment of 1 μM CB-839 for 3 days. After wash with cold PBS, cells were fixed in cold 70% ethanol for at least one hour at 4°C. Cells were spun down at 850g and washed twice with PBS. Followed by RNase A digestion (work concentration 100 μg/ml) and PI staining (work concentration 50 μg/ml) at 37°C for 15 min, samples were analyzed on LSRII flow cytometer (488 nm excitation laser). Data were acquired using DB FACSDiva version 8.0. Forward scatter and side scatter were used to identify single cells. DNA content was quantified and analyzed by FlowJo v10.0.7 software.
Immunohistochemistry (IHC)
IHC staining was performed on consecutive sections from xenografted tumors dissected from immunocompromised NSG female mice as previously described 42. Staining was performed using antibodies against ARID1A (Cell Signaling, cat. no. 12354, 1:1000), GLS1 (Abcam, cat. no.93434, 1:1000), Ki-67 (Abcam, cat. no. ab16667, 1:500), cleaved caspase 3 (Cell Signaling, cat. no. 9661, 1:50) and serine 10 phosphorylated Histone H3 (pH3S10) (Abcam, cat. no. ab5176, 1:200). Counterstaining was performed with Mayer’s Hematoxylin (Dako, cat. no. 3309).
Mouse OCCC models
The protocols were approved by the Institutional Animal Care and Use Committee (IACUC) of the Wistar Institute. Mice are maintained at 22-23°C with 40-60% humidity and 12 hours light/12 hours dark cycle. The number of the mice used in vivo was determined by the results from in vitro experiments. Intrabursal model was performed as described 25. Briefly, 1 × 10⁶ cells were unilaterally injected into the ovarian bursa sac of 6-8 weeks old female NSG mice. For orthotopic xenografts formed by TOV21G, one week after injection, tumor bearing mice were randomized into two groups (n=6 per group). The mice in each group were orally treated with vehicle (25% (w/v) hydroxypropyl-β-cyclodextrin (HPBCD) in 10 mM citrate, pH2) and 200 mg/kg CB-839 twice daily for three weeks. For orthotopic xenografts formed by RMG1 or ARID1A knockout RMG1 cells, mice were randomized into two groups (n=7 per group) one week after injection and orally treated with vehicle (25% (w/v) hydroxypropyl-β-cyclodextrin (HPBCD) in 10 mM citrate, pH2) and 200 mg/kg CB-839 twice daily for three weeks. Tumors were surgically dissected and tumor burden was calculated on the basis of tumor weight. The analysis was performed blindly but not randomly. The Wistar Institute IACUC guideline was followed in determining the time for ending the survival experiments (e.g., tumor burden exceeds 10% of body weight).
For PDX xenograft models, passage 3 of the previously described 44 ARID1A wildtype and mutated PDXs were transplanted to ovarian bursa sac of 6-8-week-old female NSG mice. Mice were randomized into four groups one month after transplantation and orally treated with vehicle (25% (w/v) hydroxypropyl-β-cyclodextrin (HPBCD) in 10 mM citrate, pH2) or 200 mg/kg CB-839 twice daily for three weeks. Mice bearing ARID1A mutant PDXs were fed with Aspartic acid free diet due to high expression of aspartate transporter in the tumor. Tumors were surgically dissected and tumor burden was calculated on the basis of tumor weight.
For Arid1a−/−/Pik3caH1047R genetic ovarian clear cell ovarian carcinoma mouse model, intrabursal adenovirus-Cre injection was used to induce ovarian clear cell carcinoma formation in 6-8 weeks old female mice. Mice were randomized into six groups four weeks after injection. The mice were randomized into the following four treatment groups: vehicle and IgG control, CB-839 (200 mg/kg twice daily, orally) and IgG control, vehicle control and anti-PDL1 (10 mg/kg, twice a week, i.p.), and a combination of CB-839 and anti-PDL1. At the end of treatments, mice were euthanized and tumors were surgically dissected. Tumor burden was calculated on the basis of tumor weight. The survival experiment was performed following The Wistar Institute IACUC guideline (tumor burden exceeds 10% of body weight).
Immune cell profiling was analyzed as we previously described 19. Briefly, tumor cells were extracted using Mouse Dissociation Kit (Miltenyi Biotec, cat. no. 130-096-730) according to the manufacturer’s instructions. The cells were then mashed with 70-μM strainer and used for staining. For peritoneal wash, peritoneal cavity of mice was washed three times with 5 ml PBS and incubated in RBC lysis buffer (Thermo Fisher, cat. no. 00-4333-57). Live/dead cells were discriminated by Zombie Yellow™ Fixable Viability Kit (Biolegend, cat. no. 423103). Cell surface staining was performed using antibodies against CD3e (BD, cat. no. 552774, 1:1000 dilution), CD45 (Biolegend, cat. no. 103147, 1: 1000 dilution), CD4 (Biolegend, cat. no. 100516, 1:1000 dilution), CD8a (Biolegend, cat. no. 100708, 1:1000 dilution), CD69 (Biolegend, cat. no. 104510, 1:1000 dilution), PD1 (Biolegend, cat. no. 109109, 1:1000 dilution) and PDL1 (Biolegend, cat. no. 124321, 1:1000 dilution). Data were acquired using LSRII-18 and analyzed using FlowJo software.
Statistics & Reproducibility
Statistical analysis was performed using GraphPad Prism 7 (GraphPad). Analysis of variance (ANOVA) with Fisher’s least significant difference was used to identify significant differences in multiple comparisons. Spearman correlation analysis was used to examine the correlation between two factors. Log-rank test was used to compare the survival distributions among experimental groups. Experiments were repeated at least 2 times. Quantitative data are expressed as mean ± s.d. unless otherwise stated. No statistical method was used to predetermine sample size. No data were excluded from the analyses. All analysis was performed blindly but not randomly. Animal experiments were randomized.
Reporting Summary
Further information on research design is available in the Nature Research Reporting Summary linked to this article.
Extended Data
Extended Data Fig. 1. ARID1A inactivation creates a dependence on glutamine.
a-b, Validation of ARID1A knockout in parental and ARID1A knockout RMG1 (a) and OVCA429 (b) cells. Immunoblots are representative of three independent experiments with similar results. c, Top 10 metabolic pathways enriched by ARID1A knockout in OVCA429 cells determined by metabolites set enrichment analysis (MSEA). d, Contribution of glutamine to oxygen consumption in the indicated OVCA429 cells expressing shARID1A or control analyzed by Seahorse. n= 5 independent experiments. e, Colony formation and quantification of parental and ARID1A knockout OVCA429 cells with or without glutamine deprivation for 12 days. n= 4 independent experiments. f-g, A fluorescence glucose analog 2-NBDG-based glucose uptake assayed by flow cytometry analysis for the indicated parental and ARID1A knockout RMG1 (f) or OVCA429 (g) cells. n= 4 independent experiments. h, Colony formation of parental and ARID1A knockout RMG1 cells cultured in the medium with indicated concentration of glucose for 12 days. Shown are representative images of four independent experiments. Error bars represent mean with s.d. in d, e, f and g. P values were calculated using two-tailed Student t-test in d, e and Fisher’s least significant difference test in c.
Extended Data Fig. 2. GLS1 is a direct target of the SWI/SNF complex.
a, Expression of glutamine metabolism related genes in control and ARID1A knockout RMG1 cells determined by RNA-seq analysis. Note that GLS1 shows the highest upregulation in response to ARID1A knockout. n=3 independent experiments. b, The indicated ChIP-seq and input tracks in the GLS1 gene locus in parental and ARID1A knockout RMG1 cells in previously published datasets (GSE120060). c, The indicated ChIP-seq and input tracks in the GLS1 gene locus in the indicated cancer cells based on the public database mining (GSE69566, GSE124225, GSE123284 and GSE106665). d, ATAC-seq tracks in the GLS1 gene locus in parental and ARID1A knockout cells based on the indicated datasets (GSE124224, GSE106665 and GSE101966). e, Expression of GLS1 mRNA in the indicated cancer cells based on based on mining public databases (GSE124227 and GSE106665). f-g, Control and ARID1A knockdown OVCA429 cells were examined for expression of ARID1A and GLS1 by immunoblot (f) or measured for glutaminase activity (g). n= 4 independent experiments. h, Control and ARID1A knockout ES2 cells were examined for expression of ARID1A and GLS1 by immunoblot. i, The association of ARID1A, BAF155, SNF5 and RNA Pol II with the GLS1 gene promoter in parental and ARID1A knockdown OVCA429 cells was examined by ChIP-qPCR analysis. An isotype matched IgG was used as a control. n = 3 independent experiments. j, Control and wildtype ARID1A ectopically expressing OVISE cells were examined for expression of ARID1A and GLS1 by immunoblot. k, Inverse correlation between GLS1 and ARID1A expression in 274 TP53 wildtype cancer cell lines across cancer types in the Cancer Cell Line Encyclopedia RNAseq database. Immunoblots are representative of three independent experiments with similar results in f, h and j. Error bars represent mean with s.d. in e, g and i. P value was calculated using two-tailed Student t-test in e, g, i and Spearman correlation analysis in k.
Extended Data Fig. 3. Inactivation of SWI/SNF complex sensitizes cells to glutaminase inhibition.
a, Validation of GLS1 knockdown by qRT-PCR in parental and ARID1A knockout RMG1 cells expressing the indicated shGLS1s or control. n= 3 independent experiments. b, Colony formation by the indicated cells treated with the indicated doses of CB-839. Shown are representative images of 4 independent experiments with similar results. c, Dose response curves to glutaminase inhibitor CB-839 determined by colony formation assay in the indicated ARID1A-mutated OCCC and VHL-deficient renal clear cell carcinoma (RCC) cell lines. n=4 independent experiments. d, Differential sensitivity of TP53 wildtype cell lines for the indicated cancer types with SWI/SNF wildtype or mutation to GLS1 knockdown in the Project Achilles dataset. Specifically, GLS1 shRNA sensitivity score for 384 cell lines along with mutation status of member of SWI/SNF complex (ARID1A, ARID1B, SMARCA2, PHF10, SMARCA4, SMARCB1, SMARCC1, SMARCC2, SMARCD3, DPF2, ACTL6A) and TP53 were downloaded from Broad Cancer Cell Line Encyclopedia database. Only 118 cells lines with wildtype TP53 were taken for analysis. Cell lines were grouped by source tissue site and categorized into mutant (at least one mutation in any members of SWI/SNF complex) and wildtype SWI/SNF complex groups. Average sensitivity scores to GLS1 RNAi for each tissue and SWI/SNF complex groups were calculated. Average mutant SNI/SNF scores were plotted versus difference between mutant and wildtype SWI/SNF complex on a bubble plot to illustrate cancer types with association between GLS1 RNAi and SWI/SNF mutation. Size of the data circles were proportional to the number of cells lines in the tissue group. Note that the criteria for including in the analysis is with minimal 5 cell lines in the database. e, Sensitivity score of SWI/SNF wildtype or mutated skin cancer cell lines with wildtype TP53 to GLS1 knockdown in the Project Achilles dataset. f-g, Expression of GLS1 in control and GLS1 ectopically expressed ARID1A wildtype RMG1 cells determined by immunoblot (f). And the indicated cells were subjected to dose response curves to glutaminase inhibitor CB-839 determined by colony formation assay (g). n=4 independent experiments. Immunoblots are representative of two independent experiments with similar results in f. Error bars represent mean with s.d. in a, c, e and g. P values were calculated using two-tailed Student t-test in a, e and one-tailed Student t-test in d.
Extended Data Fig. 4. ARID1A inactivation increases glutamine-dependent aspartate biosynthesis.
a, Quantification the indicated metabolites determined by glutamine tracing in control and ARID1A knockout RMG1 cells. n= 3 independent experiments. b, Quantification of colony formation by parental or ARID1A knockout OVCAR429 cells cultured in medium supplemented with or without 5 mM aspartate treated with or without CB-839 (0.1 μM or 0.25 μM). n= 4 independent experiments. c, Expression of SLC1A3 in RMG1 and OVCA429 cells determined by qRT-PCR analysis. n= 3 independent experiments. d, Expression of SLC1A3 in ARID1A knockout RMG1 cells with or without ectopic SLC1A3 expression determined by qRT-PCR analysis. n= 3 independent experiments. e, Cell cycle distribution in RMG1 ARID1A KO cells treated with or without 1 μM CB-839 for 72 hrs determined by flow cytometry analysis. n= 3 independent experiments. f, Schematic of glutamine-dependent aspartate biogenesis through the TCA cycle. g-h, Relative expression of genes encoding for enzymes that contribute to aspartate biogenesis from glutamine through the TCA cycle determined by qRT-PCR analysis in parental control and ARID1A knockout RMG1 cells (g) or OVCA429 cells with or without ARID1A knockdown (h) cells. Validation of 3 independent experiments as shown in Extended Data Fig. 2a. Error bars represent mean with s.d. in a, b, c, d, e, g and h. P values were calculated using two-tailed Student t-test in a, b, c, d, e, g and h.
Extended Data Fig. 5. Glutaminase inhibitor CB-839 suppresses the growth of ARID1A-inactivated OCCCs in vivo.
a, Schematic of experimental design and reference time of the mouse experiment. Cells were orthotopically transplanted into non-obese diabetic/severe combined immunodeficiency gamma (NSG) mice and allowed to establish for one week. After the tumors presented palpable masses, the mice were randomized into various treatment groups and treated for an additional three weeks. At the end of treatment of three weeks, mice from various treatment groups were euthanized for measuring tumor weight as a surrogate for tumor burden or followed for survival experiment. b-c, Orthotopic xenografts formed by ARID1A knockout (b) or control RMG1 cells (c) were treated with vehicle or CB-839 for 3 weeks (n=7 mice/group). At the end of the treatment, tumor weight was measured as surrogate for tumor burden. d-e, Tumors dissected from b-c, were subjected to immunological staining for GLS1, cell proliferation marker Ki67, mitotic marker serine 10 phosphorylated histone H3 (pH3S10) or apoptosis marker cleaved caspase 3 on serial sections (d) and the histological score (H-score) of the indicated markers was quantified from three separate fields from seven tumors from seven individual mice in each of the indicated treatment groups (e). Scale bar = 100 μm. f, Orthotopic xenografts formed by ARID1A-mutated TOV21G cells were treated with vehicle or CB-839 for three weeks (n=6 mice/group). Body weight of tumor bearing mice was measured at the indicated time point. Error bars represent mean with s.d. in b, c, e and f. P values were calculated using two-tailed Student t-test in b, c and e.
Extended Data Fig. 6. CB-839 does not affect PDL1 expression.
a, The gating strategy used for determining the percentage of PD1+/CD8+ T cell populations. b, ARID1A-mutated TOV21G cells were treated with vehicle or CB-839 (100 nM) for 48 hours and expression of PDL1 was examined by flow cytometry analysis. n = 3 independent experiments. Error bars represent mean with s.d. in b. P values were calculated using two-tailed Student t-test in b.
Supplementary Material
Changes in metabolites induced by ARID1A knockout in RMG1 cells determined by LC-MS/MS
List of primers used in this study
Acknowledgements
We thank Drs. Zachary Stine and Celeste Simon from University of Pennsylvania for UMRC2 and RCC4 cell lines. This work was supported by US National Institutes of Health grants (R01CA160331, R01CA163377, R01CA202919, R01CA239128 and P01AG031862 to R. Z.; P50CA228991 to R. Z. and R.D.; K99CA241395 to S.K.; R50CA221838 to H.-Y.T., S10OD023658, and S10OD023586 to DWS; R01CA195670 to D.G.H., F31CA247336 to J.Z. and T32CA009191 to T.N.) and US Department of Defense (OC180109 and OC190181 to R. Z.). The Honorable Tina Brozman Foundation for Ovarian Cancer Research (to R.Z. and R.D.) and Ovarian Cancer Research Alliance (Collaborative Research Development Grant to R.Z., and Ann and Sol Schreiber Mentored Investigator Award to S.W. and J.L.). Support of Core Facilities was provided by Cancer Centre Support Grant (CCSG) CA010815 to The Wistar Institute.
Footnotes
Competing Interests Statement
The Authors declare no competing interests.
Data Availability
The previously published ChIP-seq data that were reanalyzed here are available in the Gene Expression Omnibus (GEO) under accession codes GSE120060 45, GSE69566 46, GSE124225 47 and GSE123284 48. Previously published RNA sequencing data that were reanalyzed here are available under accession codes GSE106665 49 and GSE124227 47. Previously published ATAC-seq data that were reanalyzed here are available under accession codes GSE124224 47, GSE106665 49 and GSE101966 50. Metabolomics data have been deposited into MassIVE under accession code MSV000086347. Cancer cell line encyclopedia RNA sequencing data were downloaded from https://portals.broadinstitute.org/ccle/data/. The human lung adenocarcinoma, renal clear cell carcinoma, skin cutaneous melanoma and uterine corpus endometrial carcinoma data were derived from https://www.cbioportal.org/. Source data for unprocessed immunoblots for Fig. 1c, 2b, 2e-j, 3a, 3f and Extended Data Fig. 1a-b, 2f, 2h, 3f and source data used for statistical analyses have been provided as Source Data files. All other data supporting the findings of this study are available from the corresponding author on reasonable request.
References
- 1.Kadoch C & Crabtree GR Mammalian SWI/SNF chromatin remodeling complexes and cancer: Mechanistic insights gained from human genomics. Sci Adv 1, e1500447 (2015). [DOI] [PMC free article] [PubMed] [Google Scholar]
- 2.Wilson BG & Roberts CW SWI/SNF nucleosome remodellers and cancer. Nature reviews. Cancer 11, 481–492 (2011). [DOI] [PubMed] [Google Scholar]
- 3.Fukumoto T, Magno E & Zhang R SWI/SNF Complexes in Ovarian Cancer: Mechanistic Insights and Therapeutic Implications. Mol Cancer Res 16, 1819–1825 (2018). [DOI] [PMC free article] [PubMed] [Google Scholar]
- 4.Bailey MH et al. Comprehensive Characterization of Cancer Driver Genes and Mutations. Cell 173, 371–385 e318 (2018). [DOI] [PMC free article] [PubMed] [Google Scholar]
- 5.Lawrence MS et al. Discovery and saturation analysis of cancer genes across 21 tumour types. Nature 505, 495–501 (2014). [DOI] [PMC free article] [PubMed] [Google Scholar]
- 6.Jones S et al. Frequent mutations of chromatin remodeling gene ARID1A in ovarian clear cell carcinoma. Science 330, 228–231 (2010). [DOI] [PMC free article] [PubMed] [Google Scholar]
- 7.Murakami R et al. Exome Sequencing Landscape Analysis in Ovarian Clear Cell Carcinoma Shed Light on Key Chromosomal Regions and Mutation Gene Networks. Am J Pathol 187, 2246–2258 (2017). [DOI] [PubMed] [Google Scholar]
- 8.Wiegand KC et al. ARID1A mutations in endometriosis-associated ovarian carcinomas. N Engl J Med 363, 1532–1543 (2010). [DOI] [PMC free article] [PubMed] [Google Scholar]
- 9.Mackay HJ et al. Prognostic relevance of uncommon ovarian histology in women with stage III/IV epithelial ovarian cancer. Int J Gynecol Cancer 20, 945–952 (2010). [DOI] [PubMed] [Google Scholar]
- 10.Penson RT, Dizon DS & Birrer MJ Clear cell cancer of the ovary. Curr Opin Oncol 25, 553–557 (2013). [DOI] [PubMed] [Google Scholar]
- 11.Zhang J, Pavlova NN & Thompson CB Cancer cell metabolism: the essential role of the nonessential amino acid, glutamine. EMBO J 36, 1302–1315 (2017). [DOI] [PMC free article] [PubMed] [Google Scholar]
- 12.Curthoys NP & Watford M Regulation of glutaminase activity and glutamine metabolism. Annu Rev Nutr 15, 133–159 (1995). [DOI] [PubMed] [Google Scholar]
- 13.Consortium GT Human genomics. The Genotype-Tissue Expression (GTEx) pilot analysis: multitissue gene regulation in humans. Science 348, 648–660 (2015). [DOI] [PMC free article] [PubMed] [Google Scholar]
- 14.Cassago A et al. Mitochondrial localization and structure-based phosphate activation mechanism of Glutaminase C with implications for cancer metabolism. Proc Natl Acad Sci U S A 109, 1092–1097 (2012). [DOI] [PMC free article] [PubMed] [Google Scholar]
- 15.Jelinic P et al. Immune-Active Microenvironment in Small Cell Carcinoma of the Ovary, Hypercalcemic Type: Rationale for Immune Checkpoint Blockade. J Natl Cancer Inst (2018). [DOI] [PMC free article] [PubMed] [Google Scholar]
- 16.Miao D et al. Genomic correlates of response to immune checkpoint therapies in clear cell renal cell carcinoma. Science 359, 801–806 (2018). [DOI] [PMC free article] [PubMed] [Google Scholar]
- 17.Pan D et al. A major chromatin regulator determines resistance of tumor cells to T cell-mediated killing. Science 359, 770–775 (2018). [DOI] [PMC free article] [PubMed] [Google Scholar]
- 18.Anagnostou V et al. Multimodal genomic features predict outcome of immune checkpoint blockade in non-small-cell lung cancer. Nature Cancer 1, 99–111 (2020). [DOI] [PMC free article] [PubMed] [Google Scholar]
- 19.Fukumoto T et al. HDAC6 inhibition synergizes with anti-PD-L1 therapy in ARID1A-inactivated ovarian cancer. Cancer Res (2019). [DOI] [PMC free article] [PubMed] [Google Scholar]
- 20.Abou Alaiwi S et al. Mammalian SWI/SNF Complex Genomic Alterations and Immune Checkpoint Blockade in Solid Tumors. Cancer Immunol Res (2020). [DOI] [PMC free article] [PubMed] [Google Scholar]
- 21.Shen J et al. ARID1A deficiency promotes mutability and potentiates therapeutic antitumor immunity unleashed by immune checkpoint blockade. Nat Med (2018). [DOI] [PMC free article] [PubMed] [Google Scholar]
- 22.Hamanishi J et al. Safety and Antitumor Activity of Anti-PD-1 Antibody, Nivolumab, in Patients With Platinum-Resistant Ovarian Cancer. J Clin Oncol 33, 4015–4022 (2015). [DOI] [PubMed] [Google Scholar]
- 23.Bitler BG et al. Synthetic lethality by targeting EZH2 methyltransferase activity in ARID1A-mutated cancers. Nat Med 21, 231–238 (2015). [DOI] [PMC free article] [PubMed] [Google Scholar]
- 24.Guan B, Wang TL & Shih Ie M ARID1A, a factor that promotes formation of SWI/SNF-mediated chromatin remodeling, is a tumor suppressor in gynecologic cancers. Cancer Res 71, 6718–6727 (2011). [DOI] [PMC free article] [PubMed] [Google Scholar]
- 25.Bitler BG et al. ARID1A-mutated ovarian cancers depend on HDAC6 activity. Nat Cell Biol 19, 962–973 (2017). [DOI] [PMC free article] [PubMed] [Google Scholar]
- 26.Labuschagne CF, Zani F & Vousden KH Control of metabolism by p53 - Cancer and beyond. Biochim Biophys Acta Rev Cancer 1870, 32–42 (2018). [DOI] [PMC free article] [PubMed] [Google Scholar]
- 27.Ghandi M et al. Next-generation characterization of the Cancer Cell Line Encyclopedia. Nature 569, 503–508 (2019). [DOI] [PMC free article] [PubMed] [Google Scholar]
- 28.Xu X et al. Overview of the Development of Glutaminase Inhibitors: Achievements and Future Directions. J Med Chem 62, 1096–1115 (2019). [DOI] [PubMed] [Google Scholar]
- 29.Eads JR et al. Phase I clinical trial of the glutaminase inhibitor CB-839 plus capecitabine in patients with advanced solid tumors. Journal of Clinical Oncology 36 (2018). [Google Scholar]
- 30.Okazaki A et al. Glutaminase and poly(ADP-ribose) polymerase inhibitors suppress pyrimidine synthesis and VHL-deficient renal cancers. J Clin Invest 127, 1631–1645 (2017). [DOI] [PMC free article] [PubMed] [Google Scholar]
- 31.McDonald ER 3rd et al. Project DRIVE: A Compendium of Cancer Dependencies and Synthetic Lethal Relationships Uncovered by Large-Scale, Deep RNAi Screening. Cell 170, 577–592 e510 (2017). [DOI] [PubMed] [Google Scholar]
- 32.Xiang Y et al. Targeted inhibition of tumor-specific glutaminase diminishes cell-autonomous tumorigenesis. J Clin Invest 125, 2293–2306 (2015). [DOI] [PMC free article] [PubMed] [Google Scholar]
- 33.Daemen A et al. Pan-Cancer Metabolic Signature Predicts Co-Dependency on Glutaminase and De Novo Glutathione Synthesis Linked to a High-Mesenchymal Cell State. Cell Metab 28, 383–399 e389 (2018). [DOI] [PubMed] [Google Scholar]
- 34.Gross MI et al. Antitumor activity of the glutaminase inhibitor CB-839 in triple-negative breast cancer. Mol Cancer Ther 13, 890–901 (2014). [DOI] [PubMed] [Google Scholar]
- 35.Buck MD, O'Sullivan D & Pearce EL T cell metabolism drives immunity. J Exp Med 212, 1345–1360 (2015). [DOI] [PMC free article] [PubMed] [Google Scholar]
- 36.Chandler RL et al. Coexistent ARID1A-PIK3CA mutations promote ovarian clear-cell tumorigenesis through pro-tumorigenic inflammatory cytokine signalling. Nat Commun 6, 6118 (2015). [DOI] [PMC free article] [PubMed] [Google Scholar]
- 37.Leone RD et al. Glutamine blockade induces divergent metabolic programs to overcome tumor immune evasion. Science 366, 1013–1021 (2019). [DOI] [PMC free article] [PubMed] [Google Scholar]
- 38.Nabe S et al. Reinforce the antitumor activity of CD8(+) T cells via glutamine restriction. Cancer Sci 109, 3737–3750 (2018). [DOI] [PMC free article] [PubMed] [Google Scholar]
- 39.Lane AN & Fan TW Regulation of mammalian nucleotide metabolism and biosynthesis. Nucleic Acids Res 43, 2466–2485 (2015). [DOI] [PMC free article] [PubMed] [Google Scholar]
- 40.Zhu J & Thompson CB Metabolic regulation of cell growth and proliferation. Nat Rev Mol Cell Biol 20, 436–450 (2019). [DOI] [PMC free article] [PubMed] [Google Scholar]
- 41.Lissanu Deribe Y et al. Mutations in the SWI/SNF complex induce a targetable dependence on oxidative phosphorylation in lung cancer. Nat Med 24, 1047–1057 (2018). [DOI] [PMC free article] [PubMed] [Google Scholar]
Methods-only References
- 42.Wu S et al. SWI/SNF catalytic subunits' switch drives resistance to EZH2 inhibitors in ARID1A-mutated cells. Nat Commun 9, 4116 (2018). [DOI] [PMC free article] [PubMed] [Google Scholar]
- 43.Skene PJ, Henikoff JG & Henikoff S Targeted in situ genome-wide profiling with high efficiency for low cell numbers. Nat Protoc 13, 1006–1019 (2018). [DOI] [PubMed] [Google Scholar]
- 44.Zhao B et al. ARID1A promotes genomic stability through protecting telomere cohesion. Nat Commun 10, 4067 (2019). [DOI] [PMC free article] [PubMed] [Google Scholar]
- 45.Wu S et al. ARID1A spatially partitions interphase chromosomes. Sci Adv 5, eaaw5294 (2019). [DOI] [PMC free article] [PubMed] [Google Scholar]
- 46.Raab JR, Resnick S & Magnuson T Genome-Wide Transcriptional Regulation Mediated by Biochemically Distinct SWI/SNF Complexes. PLoS Genet 11, e1005748 (2015). [DOI] [PMC free article] [PubMed] [Google Scholar]
- 47.Xu G et al. ARID1A determines luminal identity and therapeutic response in estrogen-receptor-positive breast cancer. Nat Genet 52, 198–207 (2020). [DOI] [PMC free article] [PubMed] [Google Scholar]
- 48.Nagarajan S et al. ARID1A influences HDAC1/BRD4 activity, intrinsic proliferative capacity and breast cancer treatment response. Nat Genet 52, 187–197 (2020). [DOI] [PMC free article] [PubMed] [Google Scholar]
- 49.Suryo Rahmanto Y et al. Inactivation of Arid1a in the endometrium is associated with endometrioid tumorigenesis through transcriptional reprogramming. Nat Commun 11, 2717 (2020). [DOI] [PMC free article] [PubMed] [Google Scholar]
- 50.Kelso TWR et al. Chromatin accessibility underlies synthetic lethality of SWI/SNF subunits in ARID1A-mutant cancers. Elife 6 (2017). [DOI] [PMC free article] [PubMed] [Google Scholar]
Associated Data
This section collects any data citations, data availability statements, or supplementary materials included in this article.
Supplementary Materials
Changes in metabolites induced by ARID1A knockout in RMG1 cells determined by LC-MS/MS
List of primers used in this study
Data Availability Statement
The previously published ChIP-seq data that were reanalyzed here are available in the Gene Expression Omnibus (GEO) under accession codes GSE120060 45, GSE69566 46, GSE124225 47 and GSE123284 48. Previously published RNA sequencing data that were reanalyzed here are available under accession codes GSE106665 49 and GSE124227 47. Previously published ATAC-seq data that were reanalyzed here are available under accession codes GSE124224 47, GSE106665 49 and GSE101966 50. Metabolomics data have been deposited into MassIVE under accession code MSV000086347. Cancer cell line encyclopedia RNA sequencing data were downloaded from https://portals.broadinstitute.org/ccle/data/. The human lung adenocarcinoma, renal clear cell carcinoma, skin cutaneous melanoma and uterine corpus endometrial carcinoma data were derived from https://www.cbioportal.org/. Source data for unprocessed immunoblots for Fig. 1c, 2b, 2e-j, 3a, 3f and Extended Data Fig. 1a-b, 2f, 2h, 3f and source data used for statistical analyses have been provided as Source Data files. All other data supporting the findings of this study are available from the corresponding author on reasonable request.


