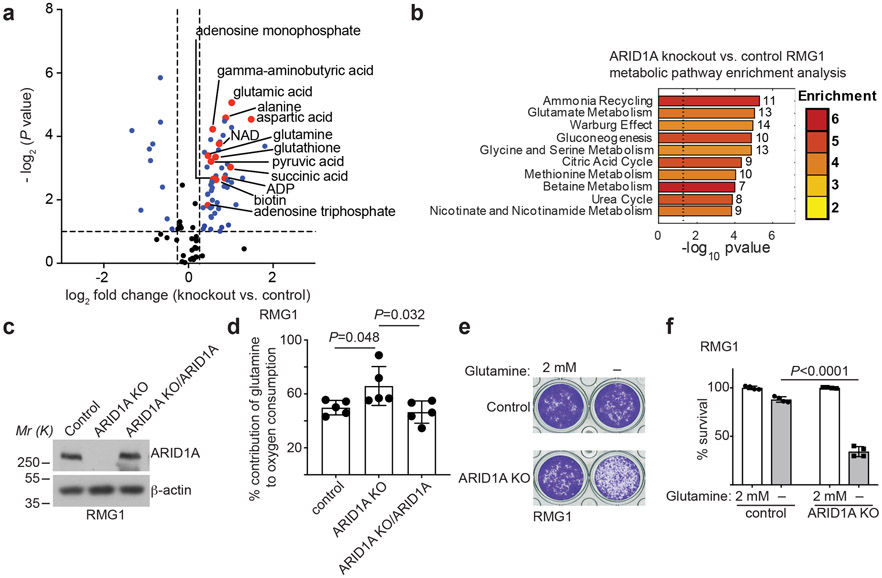
Fig. 1: ARID1A inactivation creates a dependence on glutamine.
a, Volcano plot showing changes for metabolites between control and ARID1A knockout RMG1 cells. Blue indicates changes used for enrichment analysis and red labels metabolites in glutamine metabolism. Plot shows average of 3 independent experiments (included separately as source data). b, Top 10 metabolic pathways enriched by ARID1A knockout in RMG1 cells determined by metabolites set enrichment analysis (MSEA). c, ARID1A expression in parental, ARID1A knockout RMG1 cells with or without wildtype ARID1A restoration determined by immunoblot. Shown are representative of three independent experiments with similar results. d, Contribution of glutamine to oxygen consumption in the indicated cells analyzed by Seahorse. n= 5 independent experiments. e-f, Colony formation (e) and quantification (f) of parental and ARID1A knockout RMG1 cells cultured in medium with or without glutamine deprivation for 12 days. Shown are representative of four independent experiments with similar results in e. n= 4 independent experiments in f. Error bars represent mean with s.d. in d and f. P values were calculated using two-tailed Student t-test in a, d, f and Fisher’s least significant difference test in b.

