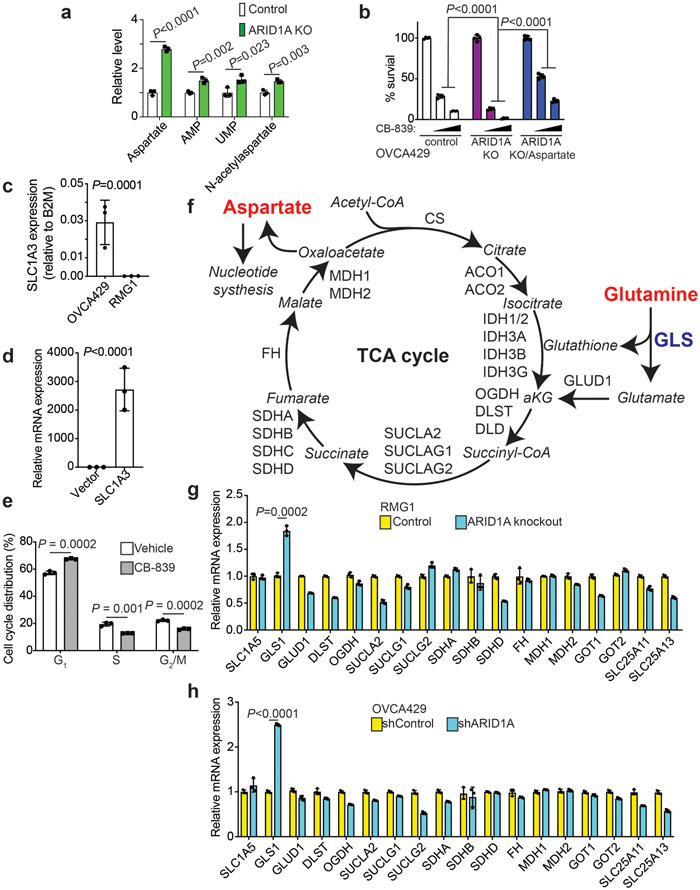
Extended Data Fig. 4. ARID1A inactivation increases glutamine-dependent aspartate biosynthesis.
a, Quantification the indicated metabolites determined by glutamine tracing in control and ARID1A knockout RMG1 cells. n= 3 independent experiments. b, Quantification of colony formation by parental or ARID1A knockout OVCAR429 cells cultured in medium supplemented with or without 5 mM aspartate treated with or without CB-839 (0.1 μM or 0.25 μM). n= 4 independent experiments. c, Expression of SLC1A3 in RMG1 and OVCA429 cells determined by qRT-PCR analysis. n= 3 independent experiments. d, Expression of SLC1A3 in ARID1A knockout RMG1 cells with or without ectopic SLC1A3 expression determined by qRT-PCR analysis. n= 3 independent experiments. e, Cell cycle distribution in RMG1 ARID1A KO cells treated with or without 1 μM CB-839 for 72 hrs determined by flow cytometry analysis. n= 3 independent experiments. f, Schematic of glutamine-dependent aspartate biogenesis through the TCA cycle. g-h, Relative expression of genes encoding for enzymes that contribute to aspartate biogenesis from glutamine through the TCA cycle determined by qRT-PCR analysis in parental control and ARID1A knockout RMG1 cells (g) or OVCA429 cells with or without ARID1A knockdown (h) cells. Validation of 3 independent experiments as shown in Extended Data Fig. 2a. Error bars represent mean with s.d. in a, b, c, d, e, g and h. P values were calculated using two-tailed Student t-test in a, b, c, d, e, g and h.

