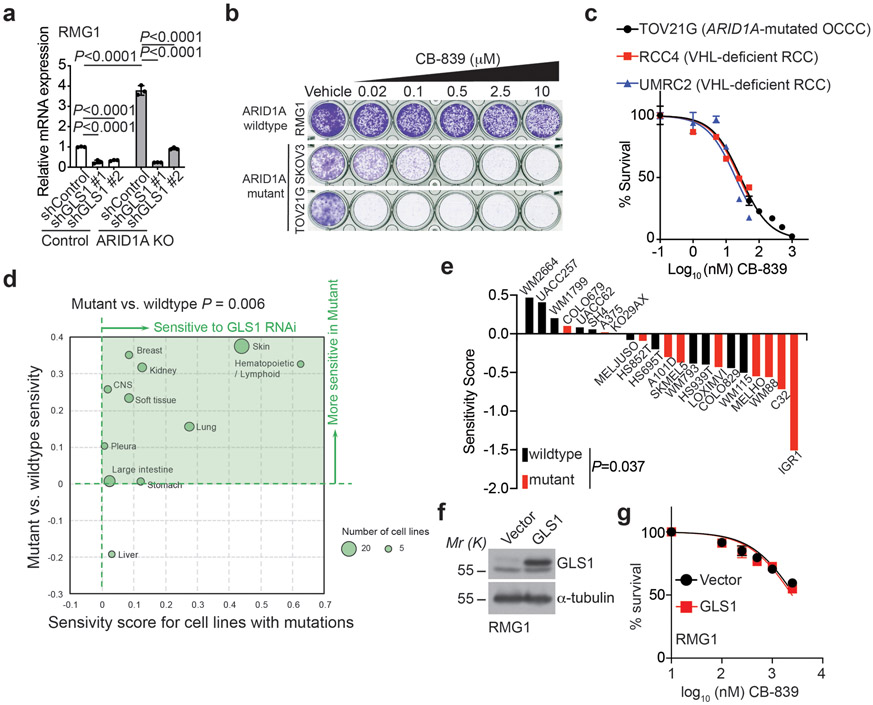
Extended Data Fig. 3. Inactivation of SWI/SNF complex sensitizes cells to glutaminase inhibition.
a, Validation of GLS1 knockdown by qRT-PCR in parental and ARID1A knockout RMG1 cells expressing the indicated shGLS1s or control. n= 3 independent experiments. b, Colony formation by the indicated cells treated with the indicated doses of CB-839. Shown are representative images of 4 independent experiments with similar results. c, Dose response curves to glutaminase inhibitor CB-839 determined by colony formation assay in the indicated ARID1A-mutated OCCC and VHL-deficient renal clear cell carcinoma (RCC) cell lines. n=4 independent experiments. d, Differential sensitivity of TP53 wildtype cell lines for the indicated cancer types with SWI/SNF wildtype or mutation to GLS1 knockdown in the Project Achilles dataset. Specifically, GLS1 shRNA sensitivity score for 384 cell lines along with mutation status of member of SWI/SNF complex (ARID1A, ARID1B, SMARCA2, PHF10, SMARCA4, SMARCB1, SMARCC1, SMARCC2, SMARCD3, DPF2, ACTL6A) and TP53 were downloaded from Broad Cancer Cell Line Encyclopedia database. Only 118 cells lines with wildtype TP53 were taken for analysis. Cell lines were grouped by source tissue site and categorized into mutant (at least one mutation in any members of SWI/SNF complex) and wildtype SWI/SNF complex groups. Average sensitivity scores to GLS1 RNAi for each tissue and SWI/SNF complex groups were calculated. Average mutant SNI/SNF scores were plotted versus difference between mutant and wildtype SWI/SNF complex on a bubble plot to illustrate cancer types with association between GLS1 RNAi and SWI/SNF mutation. Size of the data circles were proportional to the number of cells lines in the tissue group. Note that the criteria for including in the analysis is with minimal 5 cell lines in the database. e, Sensitivity score of SWI/SNF wildtype or mutated skin cancer cell lines with wildtype TP53 to GLS1 knockdown in the Project Achilles dataset. f-g, Expression of GLS1 in control and GLS1 ectopically expressed ARID1A wildtype RMG1 cells determined by immunoblot (f). And the indicated cells were subjected to dose response curves to glutaminase inhibitor CB-839 determined by colony formation assay (g). n=4 independent experiments. Immunoblots are representative of two independent experiments with similar results in f. Error bars represent mean with s.d. in a, c, e and g. P values were calculated using two-tailed Student t-test in a, e and one-tailed Student t-test in d.

