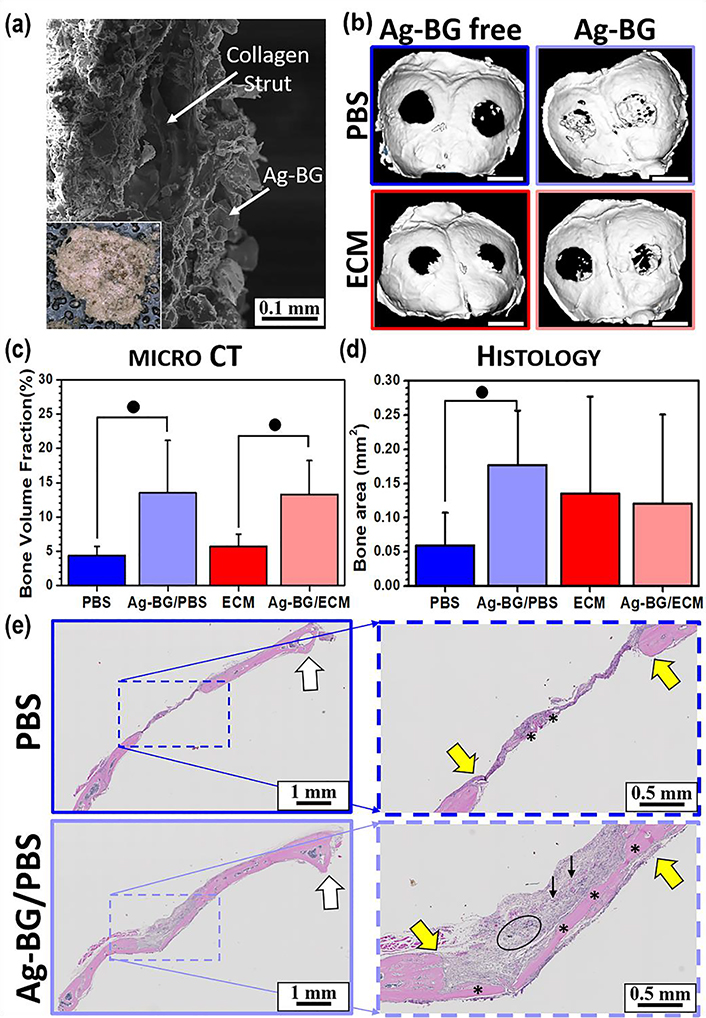
Figure 6:
SEM image from the cross-section of a representative collagen sponge loaded with Ag-BG microparticles (a) where inset shows the optical top view of the implant. Representative microCT images of the calvaria, where white scale bar represents 3 mm (b). Bone volume fraction of the new bone formed (c), and 2D assessment of bone area (d) in the defect area under different treatments for n=5 animals with 2 defects/animal. ● identifies statistical significance p<0.05 between marked groups. Coronal cross-sections of calvaria are divided in half along the sagittal crest (e) where * indicates the presence of significant soft-tissue as well as bone. Edges of the defect are indicated by yellow arrows, the circle indicates retained Ag-BG, and black arrows point to collage sponge. Note that PBS treated defect shows little overall regenerative response.

