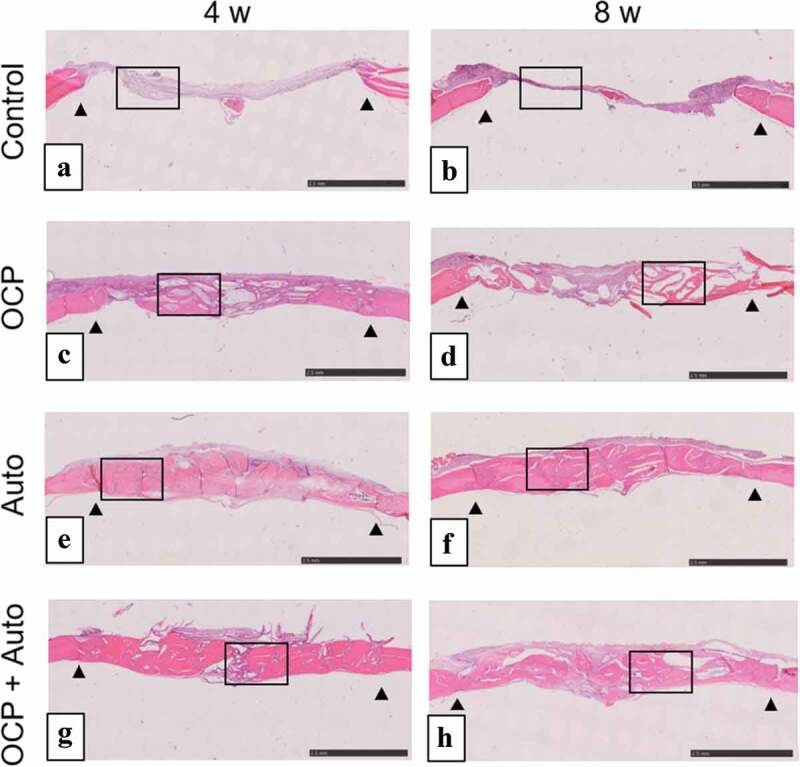
Figure 3.

Lower magnified images of rat calvarial defect regions in the sections with haematoxylin-eosin staining at 4 weeks (a, c, e, g) and 8 weeks (b, d, f, h) of implantation of no materials (Control) (a, b), OCP (c, d), autogenous bone (e, f), and mixture of OCP and bone (g, h). Bars in the images represent 2.5 mm. Arrow heads indicate the edges of bone defects
