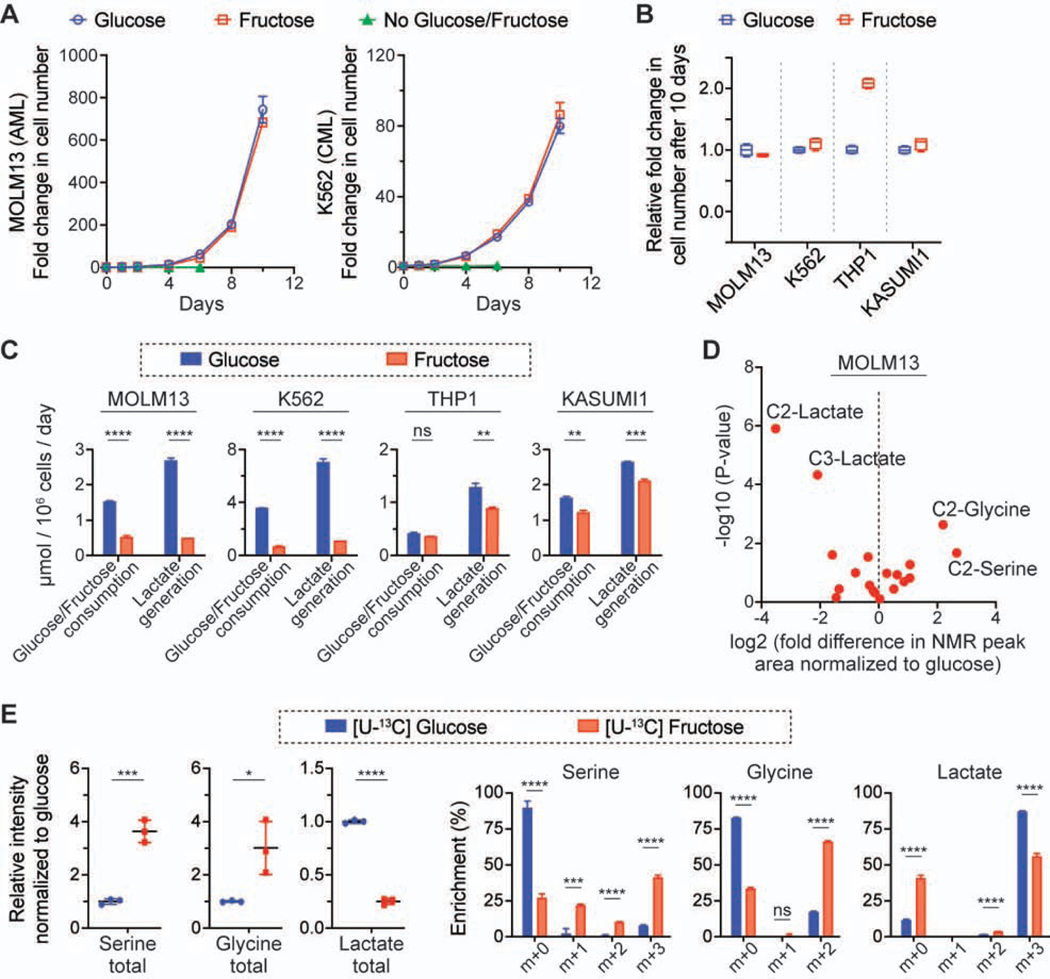
Figure 1. Leukemic cells exhibit distinct metabolism of fructose.
(A) Growth curves of MOLM13 and K562 cells in the culture media with 10 mM glucose or fructose (mean ± S.D., n = 4 biological replicates).
(B) Comparison of growth rates of four leukemic cell lines. The growth rate in the fructose-rich condition was normalized to that in the glucose-rich condition (The box-whisker plot shows the center line as median, the box limits as upper and lower quartiles, and the whiskers to minimum and maximum values).
(C) Changes in metabolites in the culture media of the four leukemic cell lines (mean ± S.D., n = 3 biological replicates).
(D) Comparison of 13C-NMR spectra of the media after MOLM13 cells were cultured with 10 mM [2-13C] glucose or fructose for 2 days. The NMR peak corresponding to each metabolite was compared based on the peak area, and the fold difference was calculated with the NMR spectra from the fructose-rich condition normalized to that from the glucose-rich condition. Each dot indicates the mean value of the fold difference from three biological replicates.
(D) Comparison of the intracellular level of serine, glycine, and lactate and their enrichment in MOLM13 cells cultured with 10 mM [U-13C] glucose or fructose for 2 days. Signal intensity for the metabolites from the fructose-rich condition was normalized to that from the glucose-rich condition (mean ± S.D., n = 3 biological replicates).
All statistical analyses were conducted with unpaired two-tailed t-test: *P < 0.05, **P < 0.01, ***P < 0.001, ****P < 0.0001.

