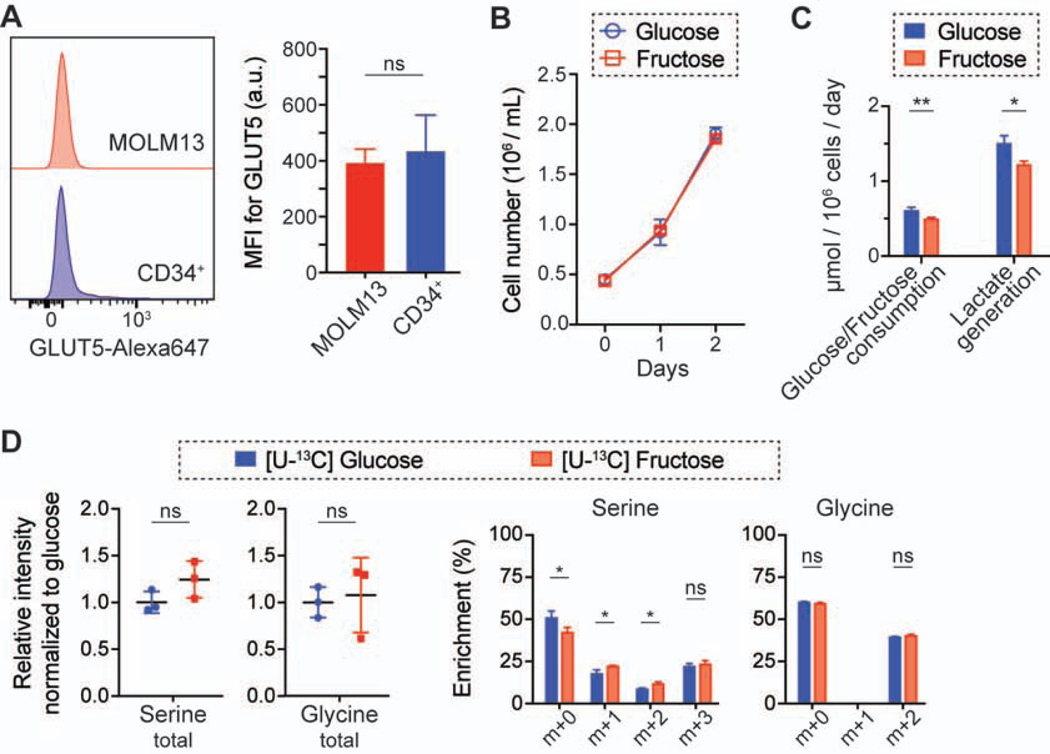
Figure 4. Normal CD34+ cells express a low level of GLUT5, but their SSP flux is not higher in fructose-rich conditions compared to glucose-rich conditions.
(A) Flow cytometry analysis of GLUT5 in MOLM13 and CD34+ cells (mean ± S.D., n = 3 biological replicates). MFI, median fluorescence intensity.
(B) Growth curves of CD34+ cells in 10 mM glucose or fructose media (mean ± S.D., n = 3 biological replicates).
(C) Changes in metabolites in the media from the experiment (B) (mean ± S.D., n = 3 biological replicates).
(D) Comparison of the intracellular level of serine and glycine and their enrichment in CD34+ cells cultured with 10 mM [U-13C] glucose or fructose for 2 days (mean ± S.D., n = 3 biological replicates).
All statistical analyses were conducted with unpaired two-tailed t-test: *P < 0.05, **P < 0.01, ***P < 0.001, ****P < 0.0001.

