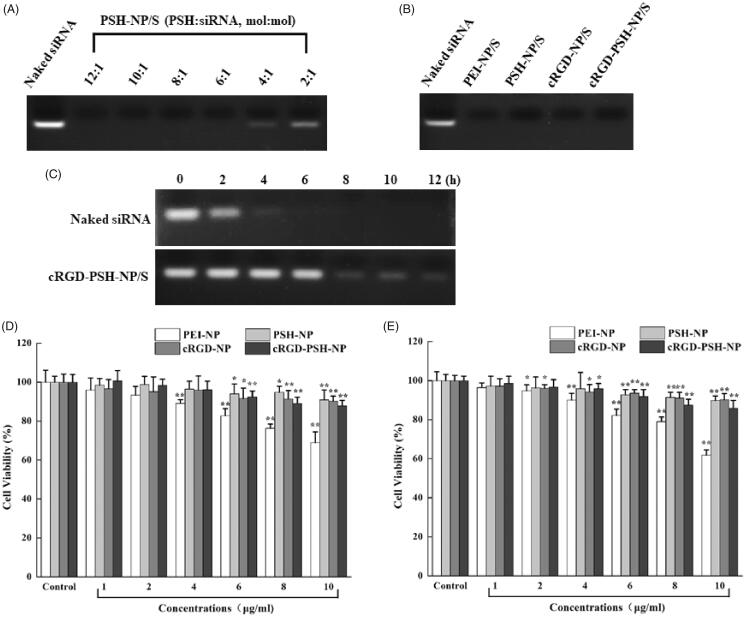
Figure 3.
Agarose gel retardation assay and cytotoxicity tests of the nanoparticles. (A) Electrophoretic bands of PSH-NP/S at various PSH/siRNA molar ratios from 12:1 to 2:1. (B) Electrophoretic bands of PEI-NP/S, PSH-NP/S, cRGD-NP/S and cRGD-PSH-NP/S. (C) Electrophoretic bands of naked siRNA and cRGD-PSH-NP/S after incubating with FBS for several time periods. (D) Cell viability of HepG-2 cells treated with PEI-NP, PSH-NP, cRGD-NP and cRGD-PSH-NP. (E) Cell viability of LO2 cells treated with PEI-NP, PSH-NP, cRGD-NP and cRGD-PSH-NP. Each bar is the mean of six experiments normalized to mean ± SD. (*p < .05 vs control; **p < .01 vs control).

