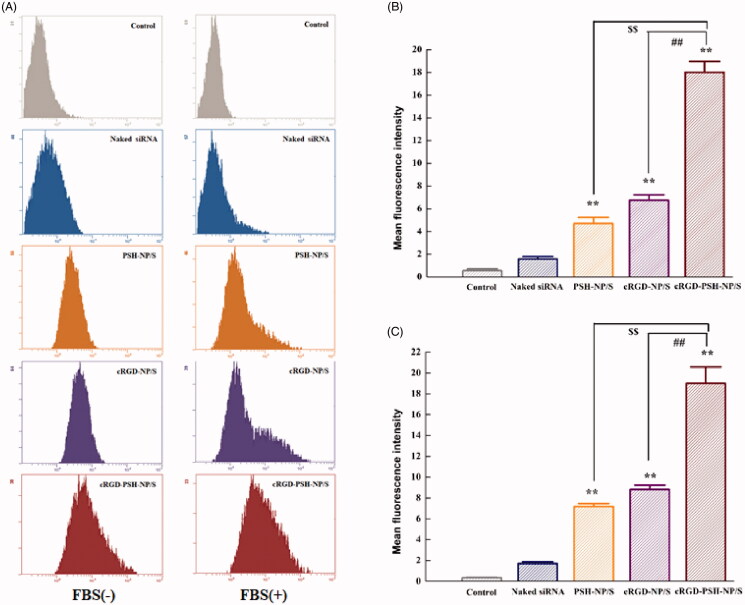
Figure 4.
Cellular uptake of 5′-Cy3-labled surviving siRNA delivered by the nanoparticles. (A) Cellular fluorescence uptake in vitro by flow cytometry in HepG2 cells without and with FBS. (B) The mean fluorescence values of HepG2 cells treated with naked siRNA, PSH-NP/S, cRGD-NP/S and cRGD-PSH-NP/S without FBS. (C) The mean fluorescence values of HepG2 cells treated with naked siRNA, PSH-NP/S, cRGD-NP/S and cRGD-PSH-NP/S with FBS. Each bar is the mean of three experiments normalized to mean ± SD. (**p < .01 vs naked siRNA; $$p < .01 vs PSH-NP/S; ##p < .01 vs cRGD-NP/S).

